Report Format – Molecular Hepatitis B, Hepatitis C and HIV Virus Programs
The RCPAQAP has changed the report format issued to participants enrolled in the Molecular Hepatitis B, Hepatitis C and HIV Virus programs. The new report format follows a standard structure that will be adopted by other programs offered by the RCPAQAP.
The structure of the new report is as follows:
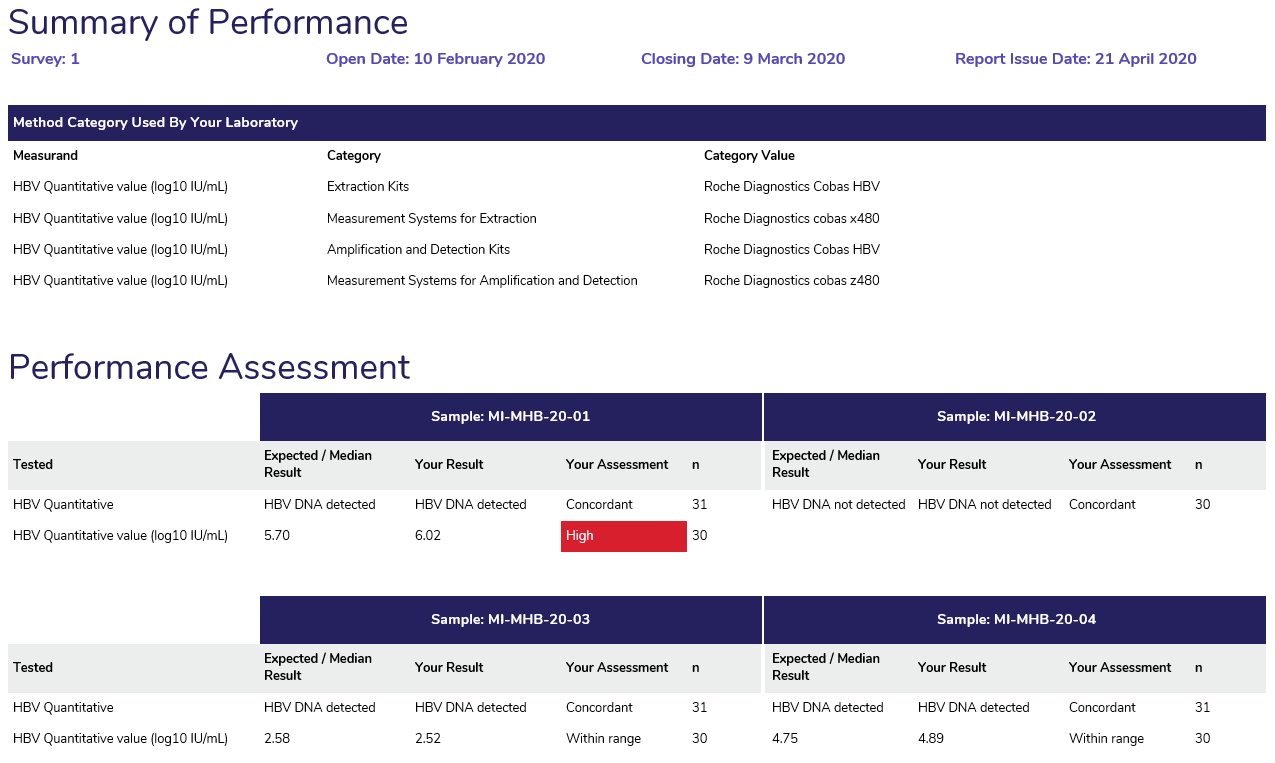
- Method Category Used By Your Laboratory: Displays the method supplied by the participant at result entry in the myQAP portal.
- Performance Assessment: Displays the expected result (qualitative measurands) or median result (quantitative measurands) for all samples surveyed, the results returned by participants with the assessment of each result and the number of participants performing each measurand. Results that require review are marked in red.
- Overall Performance: provides participants with an indication of the samples that require review if a result does not match the target result.

Expected Result – The expected result lists the target result for the measurand. The target result is based on the type of target source used – these are listed below.
i. Calculated ‘All method median’.
ii. Specific target – A sample with a known quantity of the measurand. Flagged As concordant or discordant.
Review – Results flagged for review are based on the All method median with acceptable range (+ 0.25 log10 IU/mL). These are highlighted in red and are listed as ‘High’ or ‘Low’.
Result Review
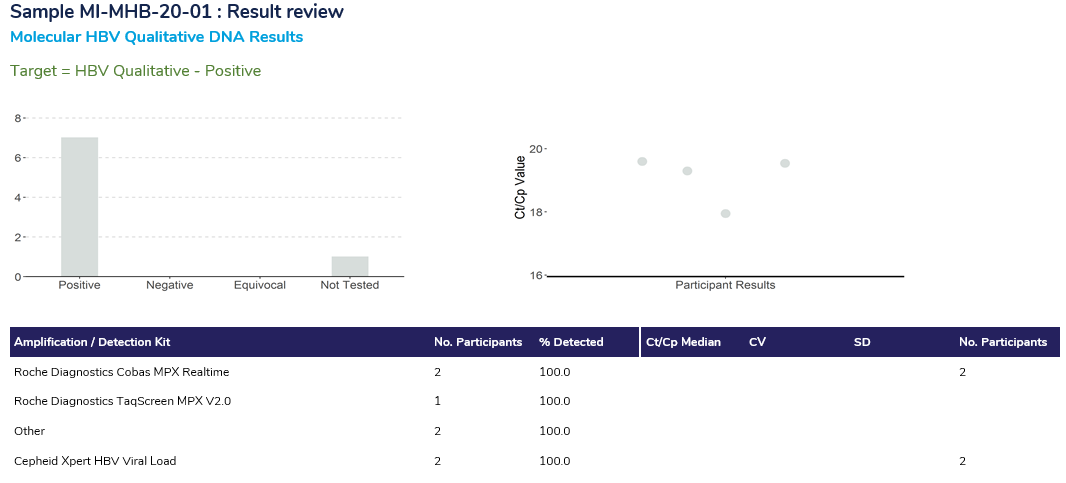
The Result Review section of the report has two sections, displaying results for the qualitative component and the quantitative section.
The Qualitative review displays the breakdown of the responses received from participants. The histogram displays the interpretive response from participants, indicating the presence of HBV DNA, HCV RNA or HIV RNA. The scatterplot displays the Ct/Cp value returned, highlighting in blue the result returned by the participant (if the participant performed this component of the survey).
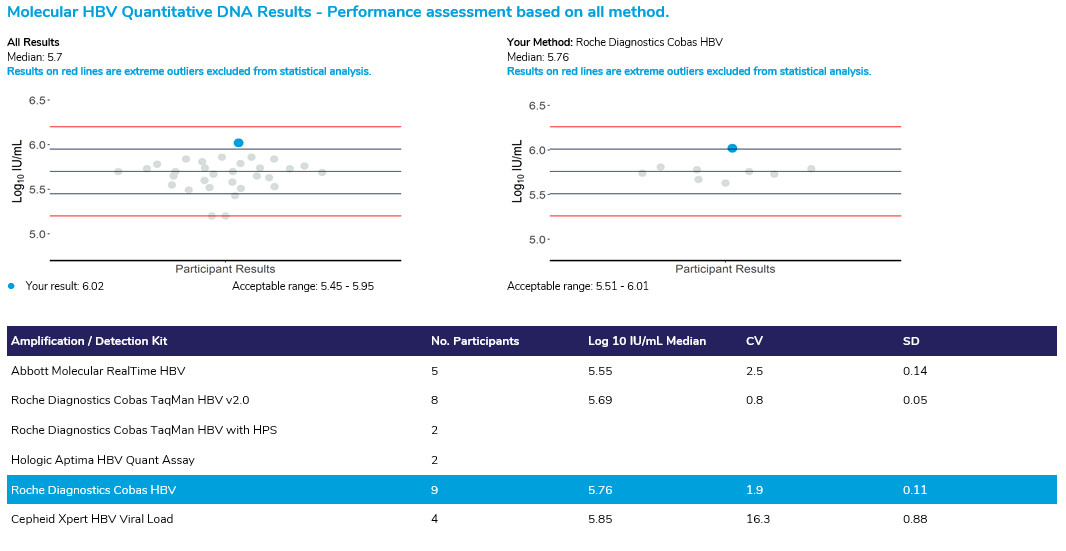
The Quantitative review displays two scatter plots, the first scatterplot displays the log10 IU/mL value returned by ALL participants and the scatterplot on the right displays the log10 IU/mL value returned from participants using the same method as your laboratory. The centre line in both scatterplots indicates the median value line, with the lines directly above and below indicating the acceptable range (+ 0.25 log10 IU/mL). The red lines in the chart provide a cut off for all results that were considered as extreme outliers. All results that appear on this line have returned results at this level or above. These results have been excluded from the statistics. Please note, if the sample has an expected result of “Not detected”, the quantitative review section will not be displayed in the report.
The Result review section provides a breakdown of the participant results by amplification/detection kit, displaying the number of participants using the kit and the results obtained from each kit for both components of the survey.
- Discussion: A discussion of the survey results will also be available at the end of the report.
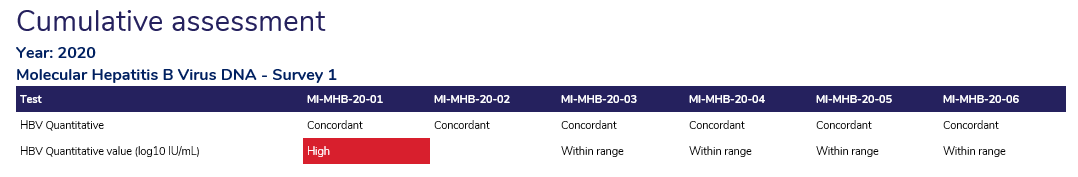
- Cumulative Assessment: All reports conclude with a cumulative assessment, which provides an indication of your performance from past surveys.
Can't find what you're looking for?
