Report Format – Bacteriology Urine Program
The RCPAQAP Microbiology has updated the report format issued to participants enrolled in the Bacteriology Urine Program. The new report format follows a standard structure that will be adopted by other programs offered by the RCPAQAP. This single report replaces the previous generic and survey reports.
The structure of the new reports is as follows:
Summary of Performance
The summary of performance provides a snapshot of your participation and assessment in the program. It has been split into 2 sections, providing a performance review for the “Microscopy, bacterial count, isolate identification and antibiotic susceptibility testing results”.
Section 1 – Microscopy, bacterial count and identification
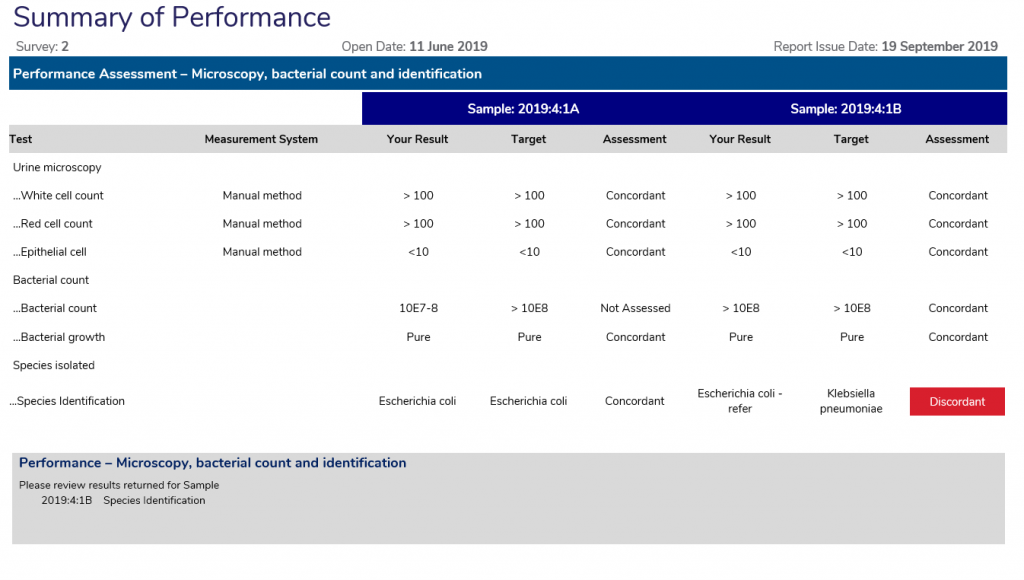
Below is an explanation of what is populated in the table columns provided in the example provided.
- Test: Is the test performed by the participant, that is assessed.
- Measurement system: Will list the measurement system returned by you at result entry in the myQAP portal.
- Your result: Is the result submitted by you at result entry in the myQAP portal.
- Target: Is the expected result
- Assessment: Will provide the assessment of your results based on the target (expected result). If a test does not return 80% consensus from participant results or does not pass homogeneity testing, the assessment grade of “Not assessed” will be assigned.
Please note – The assessment of performance now uses terminology to grade performance, which replaces the scores that has been used in the past. The terms used to assess performance are:
- Concordant: Matches the target or expected result
- Minor Discordance: Not the exact match, but a result that has one or more minor differences and would not result in an adverse patient outcome
- Discordant: Does not match the target response
- Not Assessed: Not assessed due to failure in homogeneity testing or submitted results do not reach 80% consensus.
Section 2 – Antibiotic susceptibilities
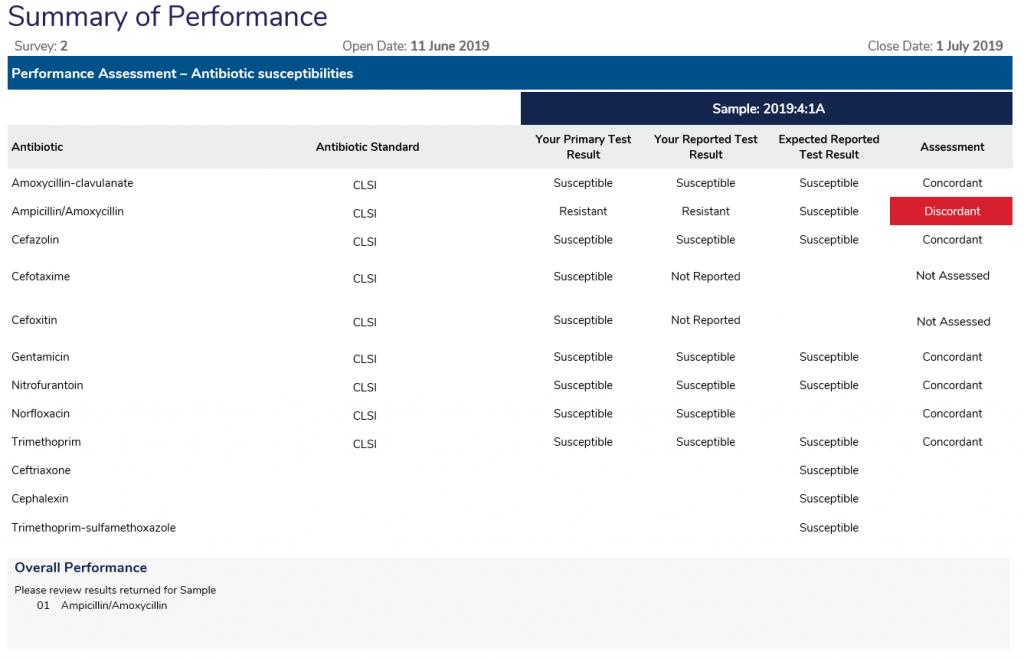
The performance review for the antibiotic susceptibility testing has been split to review the performance based on the sample. Below is an explanation of what is populated in each column in the example provided.
- Antibiotic: The antibiotics that are listed in this table are those reported from you as well as antibiotics that have pretested by our reference laboratory.
- Antibiotic standard: Will list the antibiotic susceptibility testing guidelines used by you at result entry in the myQAP portal.
- Your Primary Test Result: Is the primary test result submitted by you at result entry in the myQAP portal.
- Your Reported Test Result: Is the reported test result submitted by you at result entry in the myQAP portal.
- Expected Reported Test Result: Is the expected reported result for the antibiotics listed. An expected result will only be displayed if the antibiotic was tested for by our referral laboratory.
- Assessment: Will provide the assessment of your results based on “your reported test result”.
Please note – The assessment of performance now uses terminology to grade performance, which replaces the scores that has been used in the past. The terms used to assess performance are:
- Concordant: Matches the target or expected result
- Minor Discordance: Not the exact match, but a result that has one or more minor differences and would not result in an adverse patient outcome
- Discordant: Does not match the target response
- Not Assessed: Not assessed due to the unavailability of “an expected result”.
Discordant results will be highlighted in red and the antibiotic that is highlighted as discordant will be listed in the ‘Overall Performance’ summary at the bottom of the page.
Result Review
The review of the survey performance has been structured so you are able to see the breakdown of results by the survey case. That is, all results for Sample A will be displayed, followed by results for Sample B.
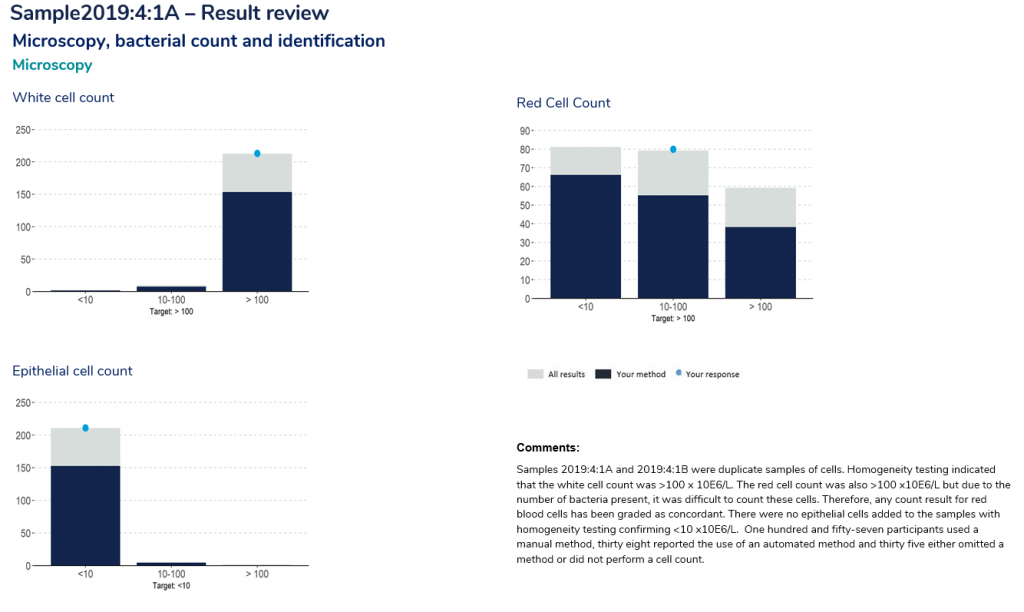
- Result review – Microscopy: Provides you with a breakdown on the responses received for the microscopy, bacterial count and species identification components of the survey. The histograms provide you with a review of the responses received for each test. The dark blue overlay represents the results returned by other participants using your method. The “blue” circle represents the result provided by your laboratory.
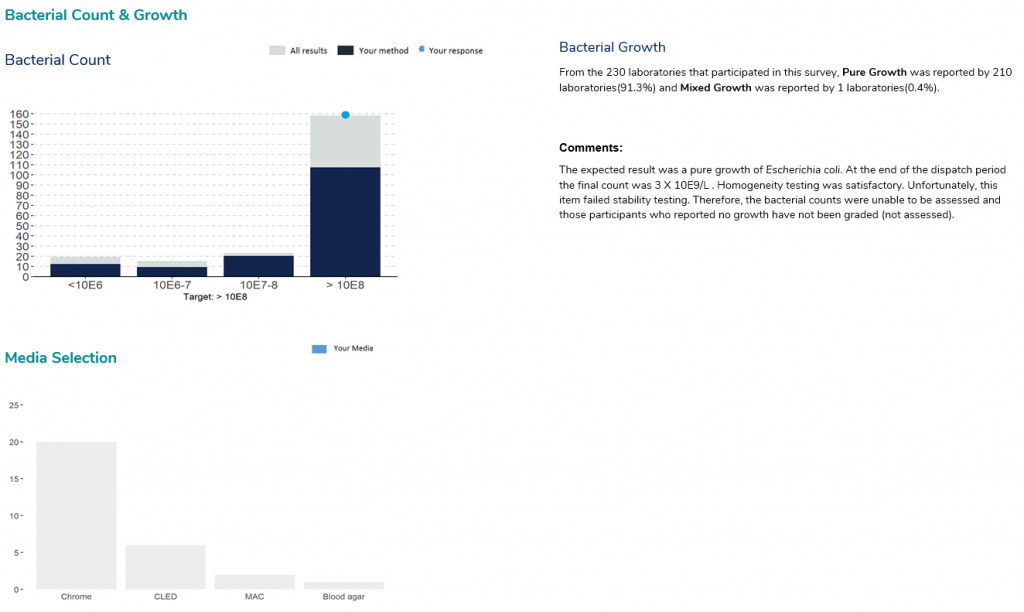
- Result review – Bacterial Count & Growth / Media Selection: Provides you with a breakdown on the responses received for the Bacterial count and growth. The histograms provide you with a review of the responses received for each test, with the same legends used for the Bacterial count chart. The “Media Selection” histogram also provides a breakdown in the responses received. The bars in this histogram will be highlighted in blue if the media was chosen by your laboratory as result entry.
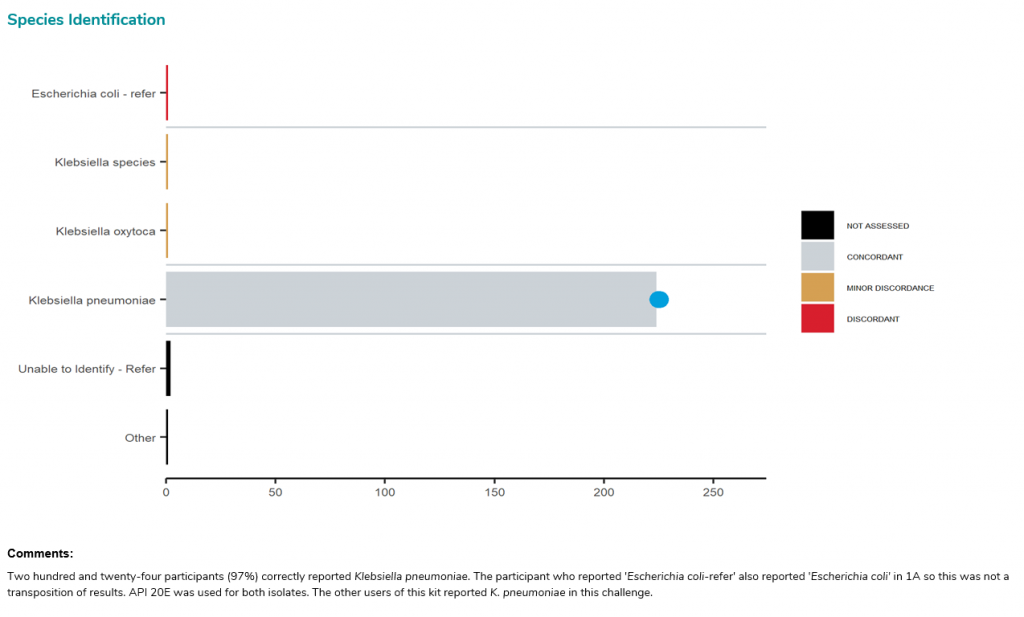
- Result review – Species Identification: Provides you with a histogram illustrating the responses received from participants for species identification. The responses are ordered by the assessment grade provided.
Please note – The terms used to assess performance are:
- Concordant: Matches the target or expected result
- Minor Discordance: Not the exact match, but a result that has one or more minor differences and would not result in an adverse patient outcome
- Discordant: Does not match the target response
- Not Assessed: This assessment grade may be provided to participants unable to grow the pathogen due to homogeneity and/or stability issues with the sample
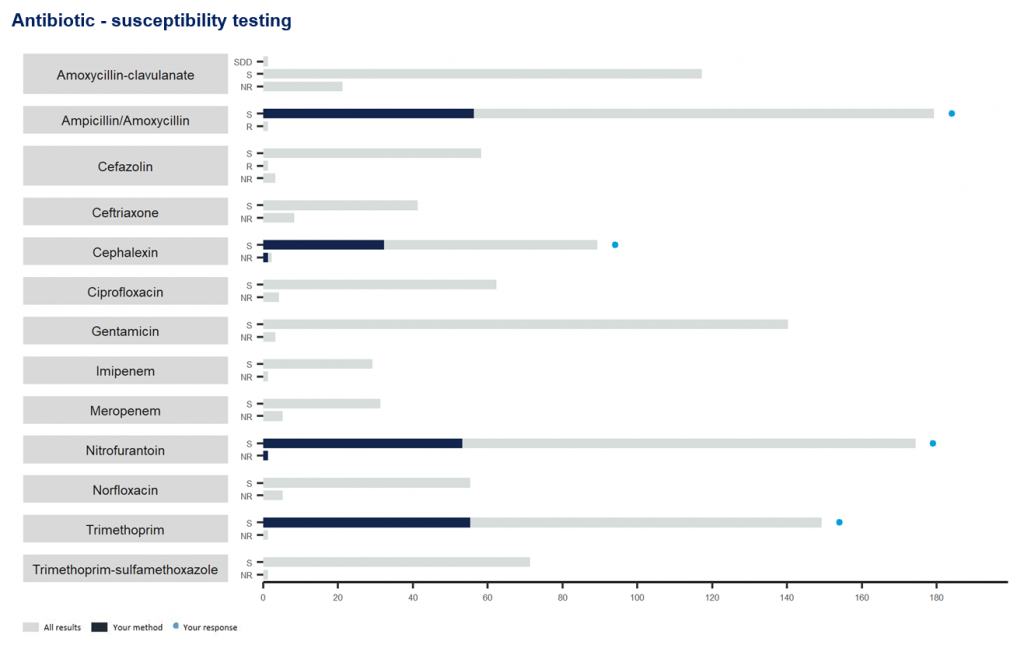
Antibiotic – susceptibility testing
The antibiotics listed in this histogram have been reported by 10 or more participants that have been assessed. The histogram displays the responses received by all laboratories that reported the antibiotic for testing, the results received. The dark blue overlay represents the results returned by other participants using the same antibiotic standard. The “blue” circle represents the result provided by your laboratory.
Cumulative Performance
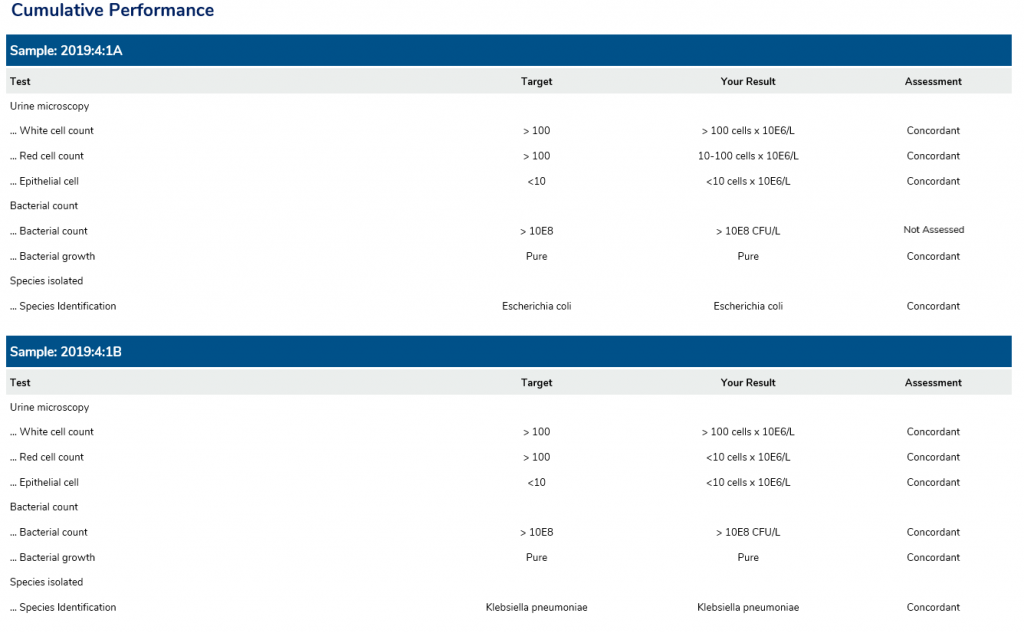
Each survey report will provide a snapshot of your performance for the Microscopy, bacterial count and identification components of the program. The cumulative performance will list your performance for each survey sample sent throughout the survey year. Please note, as survey 1 results were assessed using the number scoring system, they will not be included.
Can't find what you're looking for?
