Report Format – Key Incident Monitoring and Management System
The RCPAQAP has updated the report format issued to participants enrolled in the Key Incident Monitoring and Management System (KIMMS) program. The new report format follows a standard structure that has been adopted by all programs offered by the RCPAQAP.
The structure of the new report is as follows:
Summary of Performance
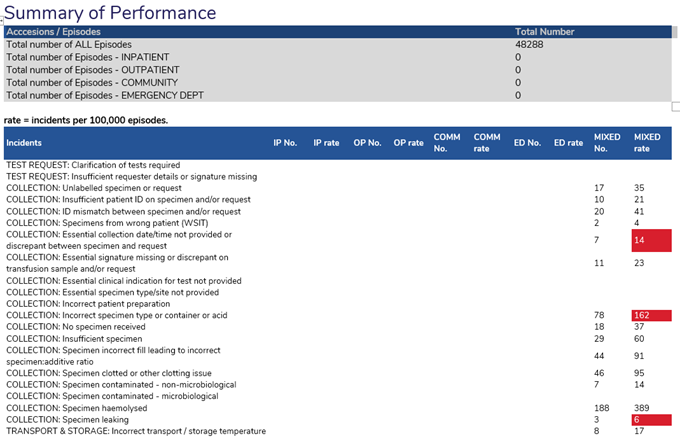
An explanation of what is populated in the table columns is provided below:
- Accessions / Episodes: The number of episodes recorded by the participant, which can be broken down into the location of where the episode was received. (An episode may comprise one or a multiple of requests, accessions and specimens, however, all are collected from the patient at the same time).
- Incidents: Each incident represents the type of error that occurred from a single episode.
- IP No. / OP No. / COMM No. / ED No. / MIXED No.: The represents the number of incidents collected from the specified locations.
- IP = Inpatient
- OP = Outpatient
- COMM = Community
- ED = Emergency Department
- MIXED = combination of IP / OP / COMM and ED
Results highlighted in red are highlighted for review and are determined based on 80% of best performance.
- IP rate / OP rate / COMM rate / ED rate / MIXED rate: Incidents per hundred thousand episodes “Calculation = result / episodes) x 100,000”.
Overall Performance
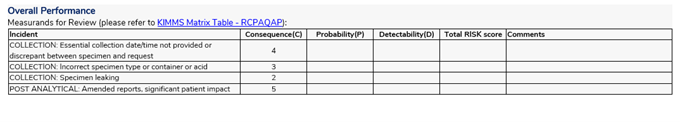
Measurands highlighted for review are listed in the “Overall Performance” table, which will list a consequence rating, based on a risk matrix, and is predetermined by the KIMMS advisory committee. The probability and detectability rating are determined by the participant, by referring to the definitions provided. The three ratings are then used to determine the risk score.
Result Review
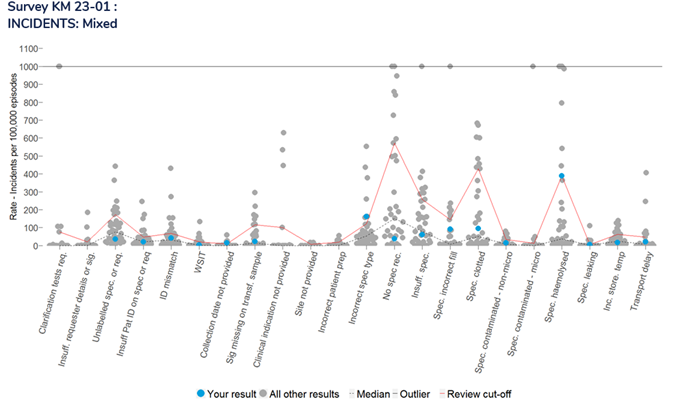
- Scatterplot of all incidents based on location: Provides a scatter of the number of incidents, reported by all laboratories, highlighting the participants result as a light blue dot within the scatter. Each page represents the scatter by location.
- X-axis – Type of incident recorded.
- Y-axis – Rate based on the number of incidents per 100,000 episodes.
- median – Median value calculated from all results returned.
- Review cut-off – Indicates the cut-off for 80% best performance.
- Outlier – Incidents greater than a rate of 1,000 incidents per 100,000 episodes are scaled down to this line to allow better visibility of remaining values.
Cumulative performance
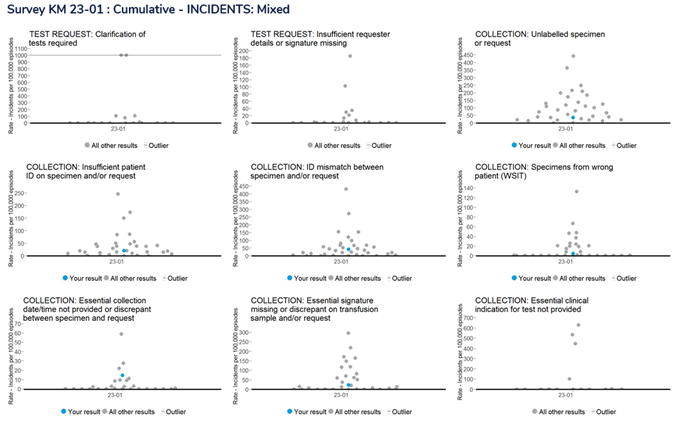
A cumulative review of participant performance is also illustrated based on all incidents recorded by the location.
The first survey will provide a scatter of the results returned for each incident, highlighting the participants response as a light blue dot. From survey two, the graphs will be converted to line charts, where participants can view their performance over the last 6 consecutive surveys.
Can't find what you're looking for?
