Report Format – Programs That Assess Quantitative Measurands (2 samples/survey)
The RCPAQAP has updated the report format issued to participants enrolled in programs that issue 2 survey samples in each survey challenge, such as many programs offered by the Chemical Pathology discipline. The new report format follows a standard structure that will be adopted by other programs offered by the RCPAQAP.
The new survey report will now incorporate linear regression analysis, previously provided in the End of Cycle report, to determine the precision and accuracy of your testing procedure.
The structure of the new report is as follows:
Summary of Performance
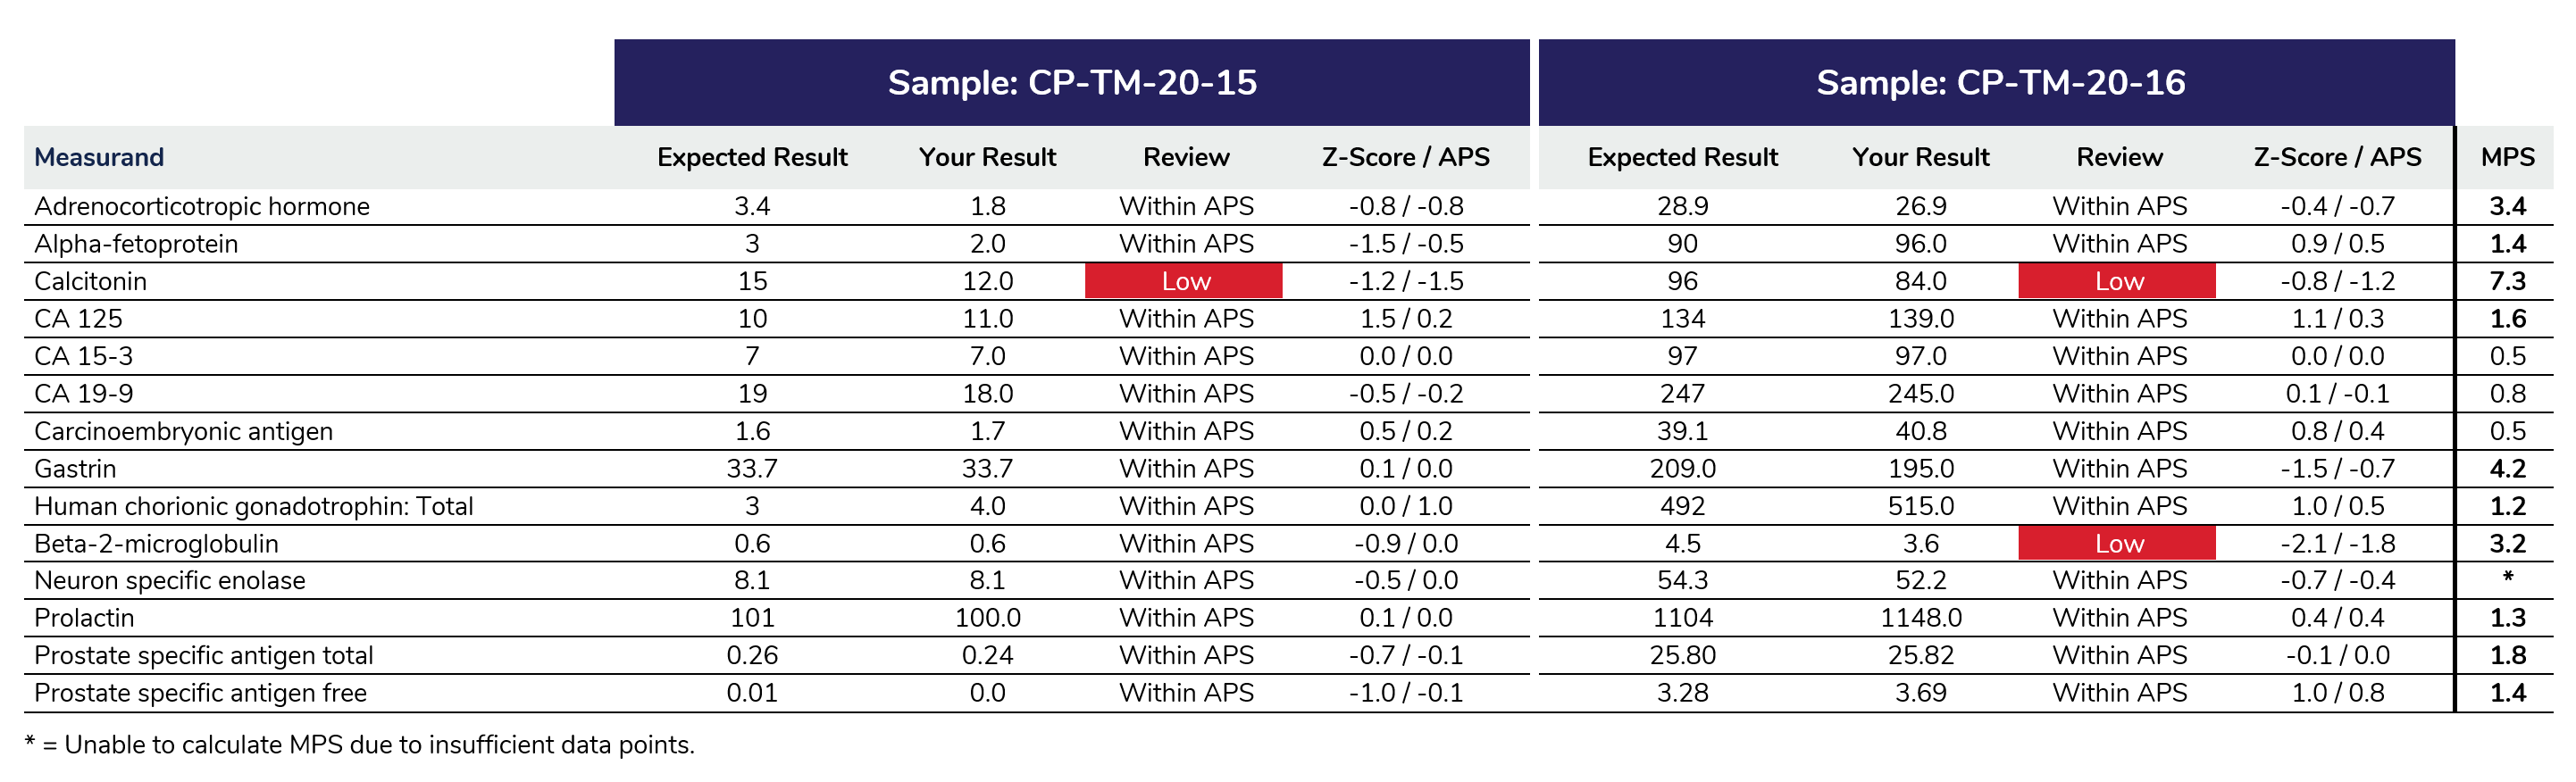
An explanation of what is populated in the table columns in the example provided below.
- Measurand: All measurands that are performed by the participant are presented in the summary table.
- Expected Result: The expected result lists the target result for the measurand. The target result is based on the type of target source used – these are listed below.
- Calculated ‘All method median’
- Calculated ‘Category median’, using the main variable of the test method. This could be the analytical principle, measurement system, reagent or calibrator. The target source is highlighted on the result page of the measurand.
- Specific target – A sample with a known quantity of the measurand. A specific target is usually assigned to samples that have been tested using a reference method or have been tested by a reference laboratory.
- Your result: The result submitted by the participant.
- Review: Results flagged for review are outside the Analytical Performance Specifications (APS). These are highlighted in red and are listed as ‘High’ or ‘Low’.
- Z-score /APS score: The z-score and APS scores are two types of performance indicators. The Z-score uses the mean result and SD to indicate the number of standard deviations a participant is away from the average result. The APS score uses the median and the assigned APS to calculate the APS score. Please refer to the RCPAQAP Data Analysis and Assessment Criteria Handbook, which provides a more detailed explanation on how the APS and Z-scores are calculated.
- MPS (Measurand Performance score): The Measurand Performance Score (MPS) is calculated by performing linear regression analysis on a set of samples (the minimum number of samples to perform linear regression is 6) and uses the SD (precision) and Bias (accuracy) obtained to determine the total error. This is then compared to the sample range’s median APS (MPS = 2SD + Bias / Allowable limit of Assessment). If the score is greater than 1.0, it is highlighted in bold to consider for further review.
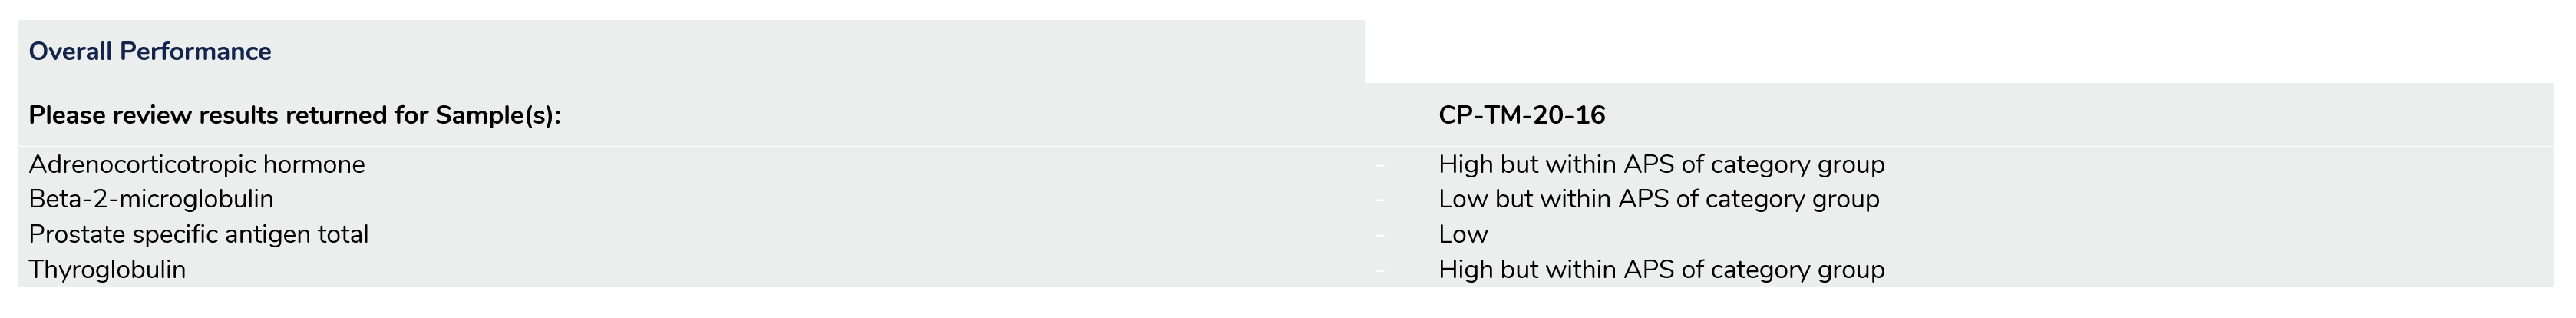
The Summary of Performance also provides participants with their overall performance, and indicates what measurands are marked for review.
Result Review
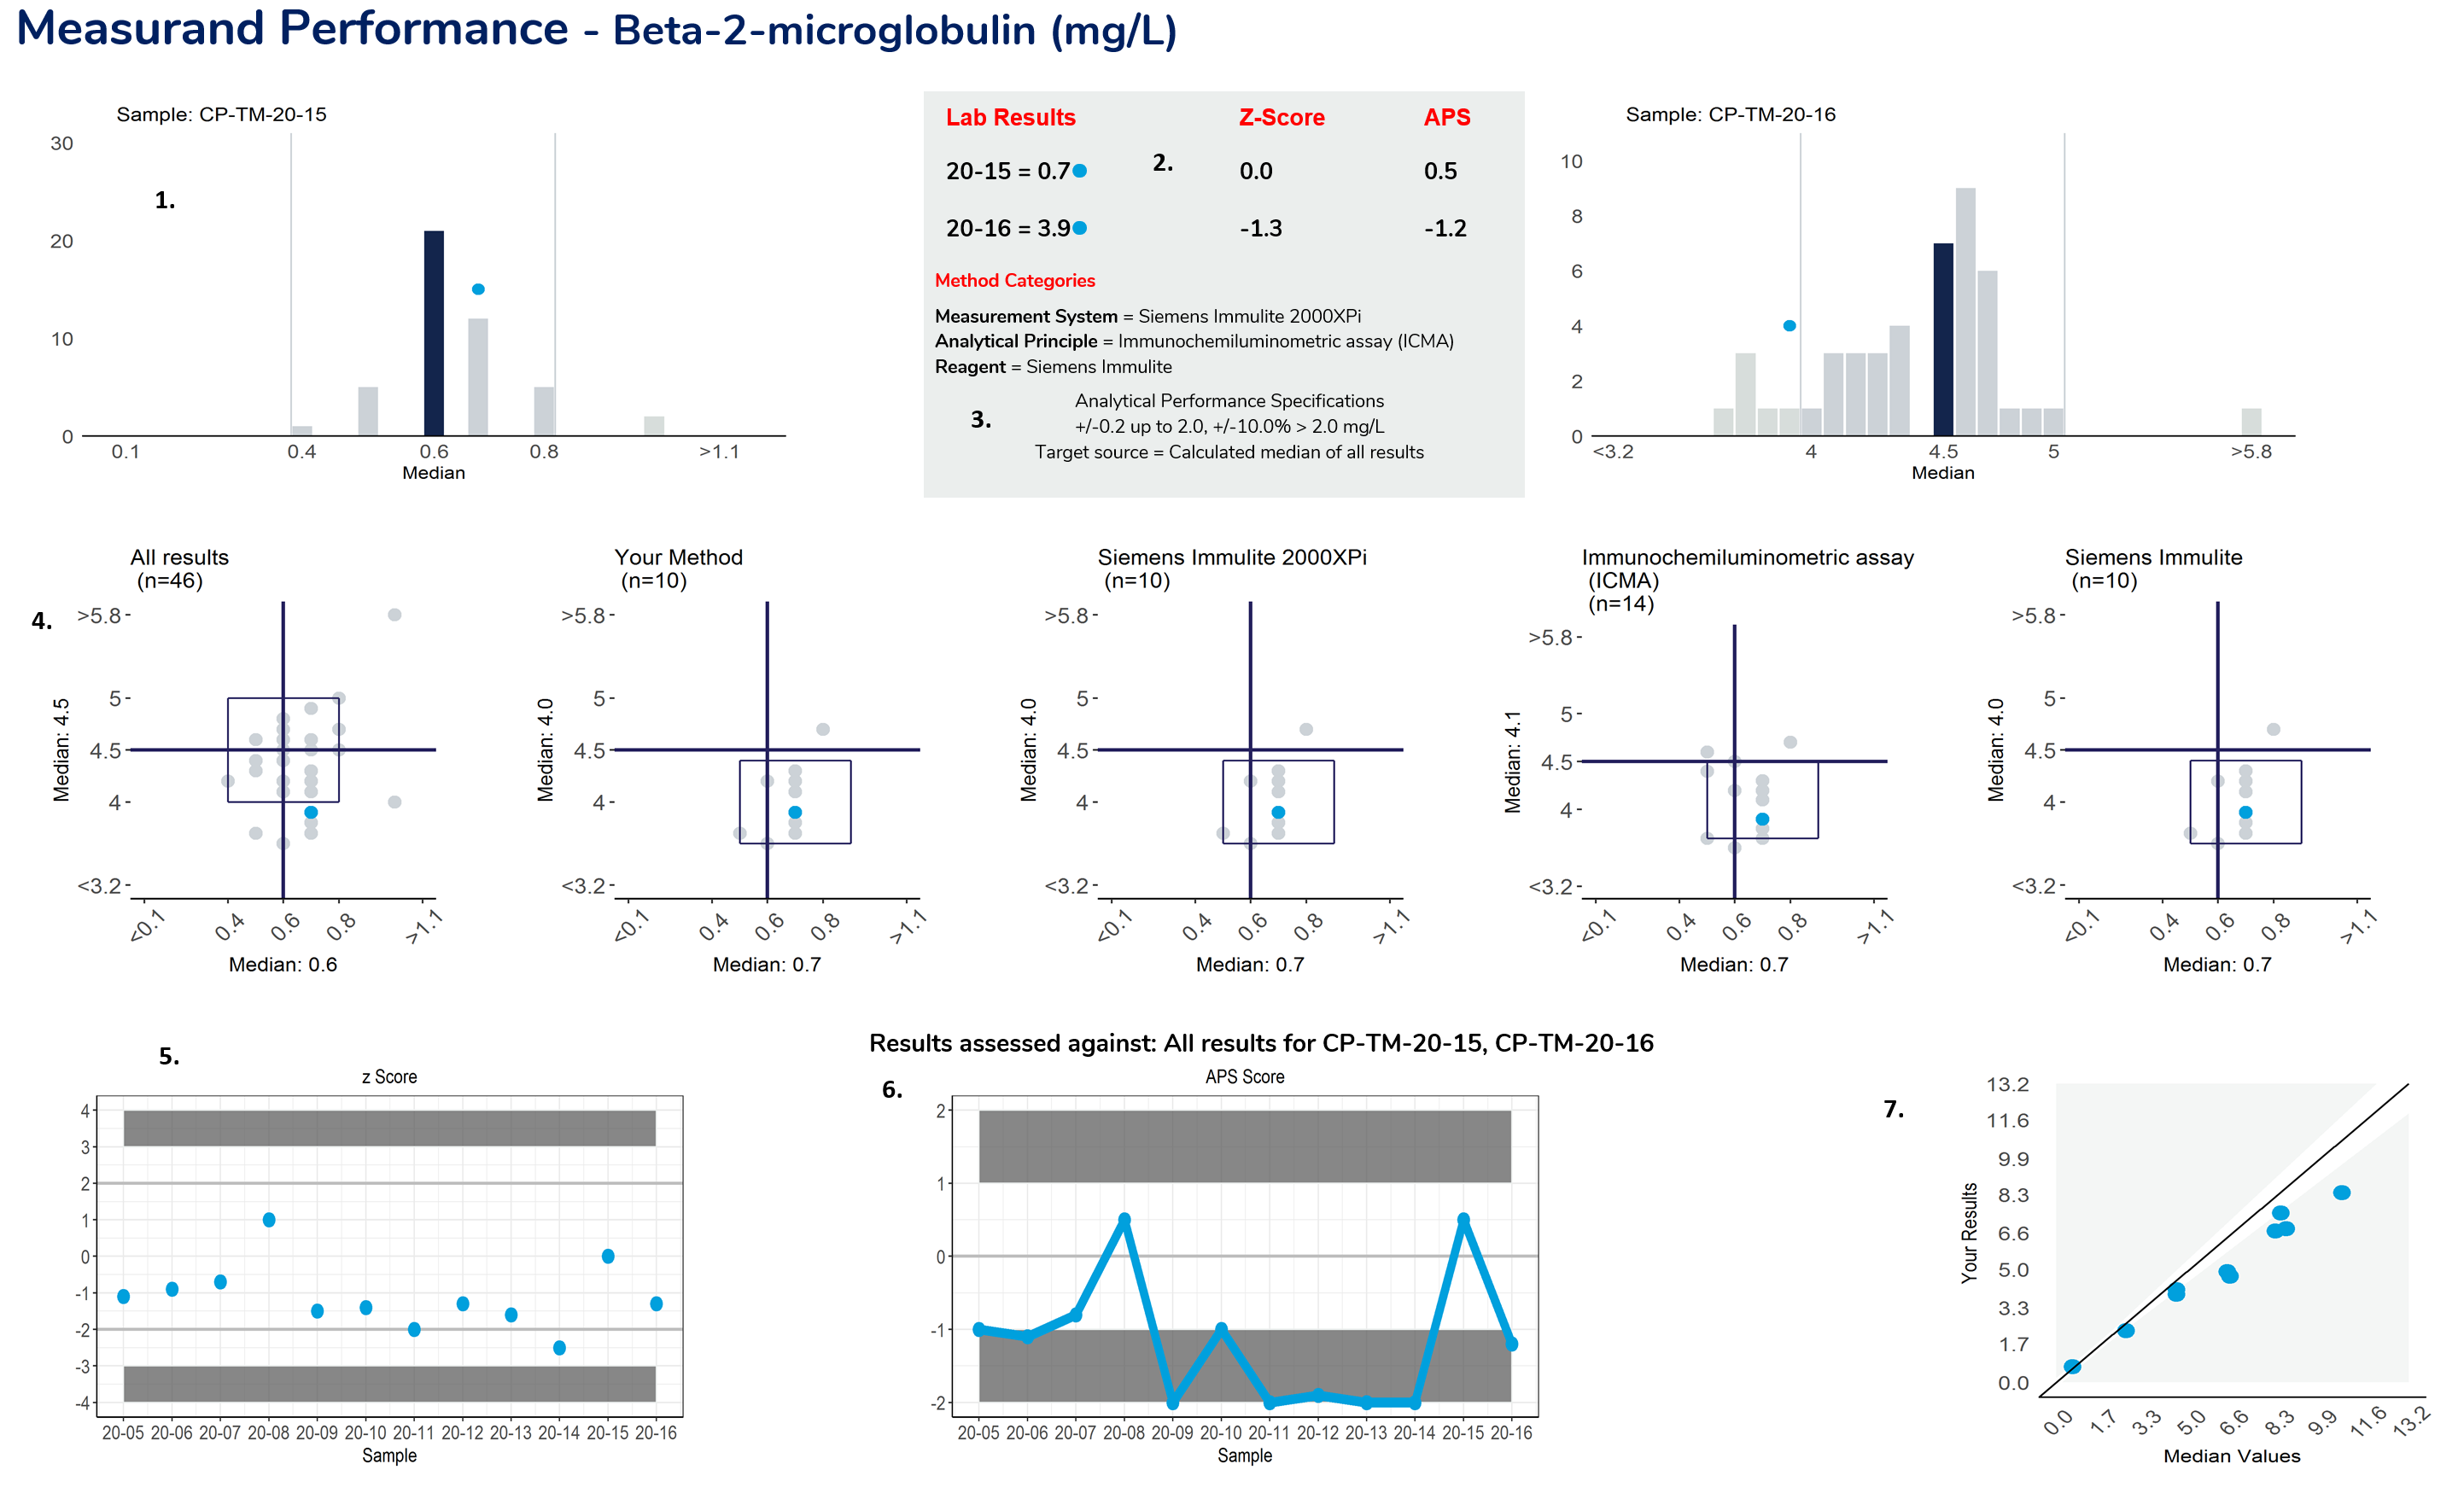
- Measurand performance: The Measurand performance page provides participants with a breakdown of the results returned.
- Histograms – provide a frequency distribution of the results submitted by all participants. The blue bar represents the median or target result, the blue circle indicates the participant’s result.
- Lab results – lists the results and method categories returned by the participant.
- Analytical Performance Specification (APS) – The APS that has been assigned to the measurand
- Youden charts – represent a scatter of 2 sample results plotted against each other. The sample with the higher measurand level is on the y-axis plotted against the lower level on the x-axis. Five Youden plots are presented, and illustrate from left to right, results from all results, the participant’s method, analytical principle, measurement system and the reagent. The participant’s result is highlighted by the blue dot.
- Levey Jennings type plot (z-score). Displays the participant’s z-score for up to 6 sets of returned results and provides an indication of the precision and accuracy of results within a survey year.
- Levey Jennings type plot (APS score). Displays the APS score for up to 6 sets of returned results and provides an indication of the precision and accuracy of results within a survey year.
- Linearity plot. Displays the participant result against the expected result, and provides indication of linearity across different survey sample levels.
Linear Regression
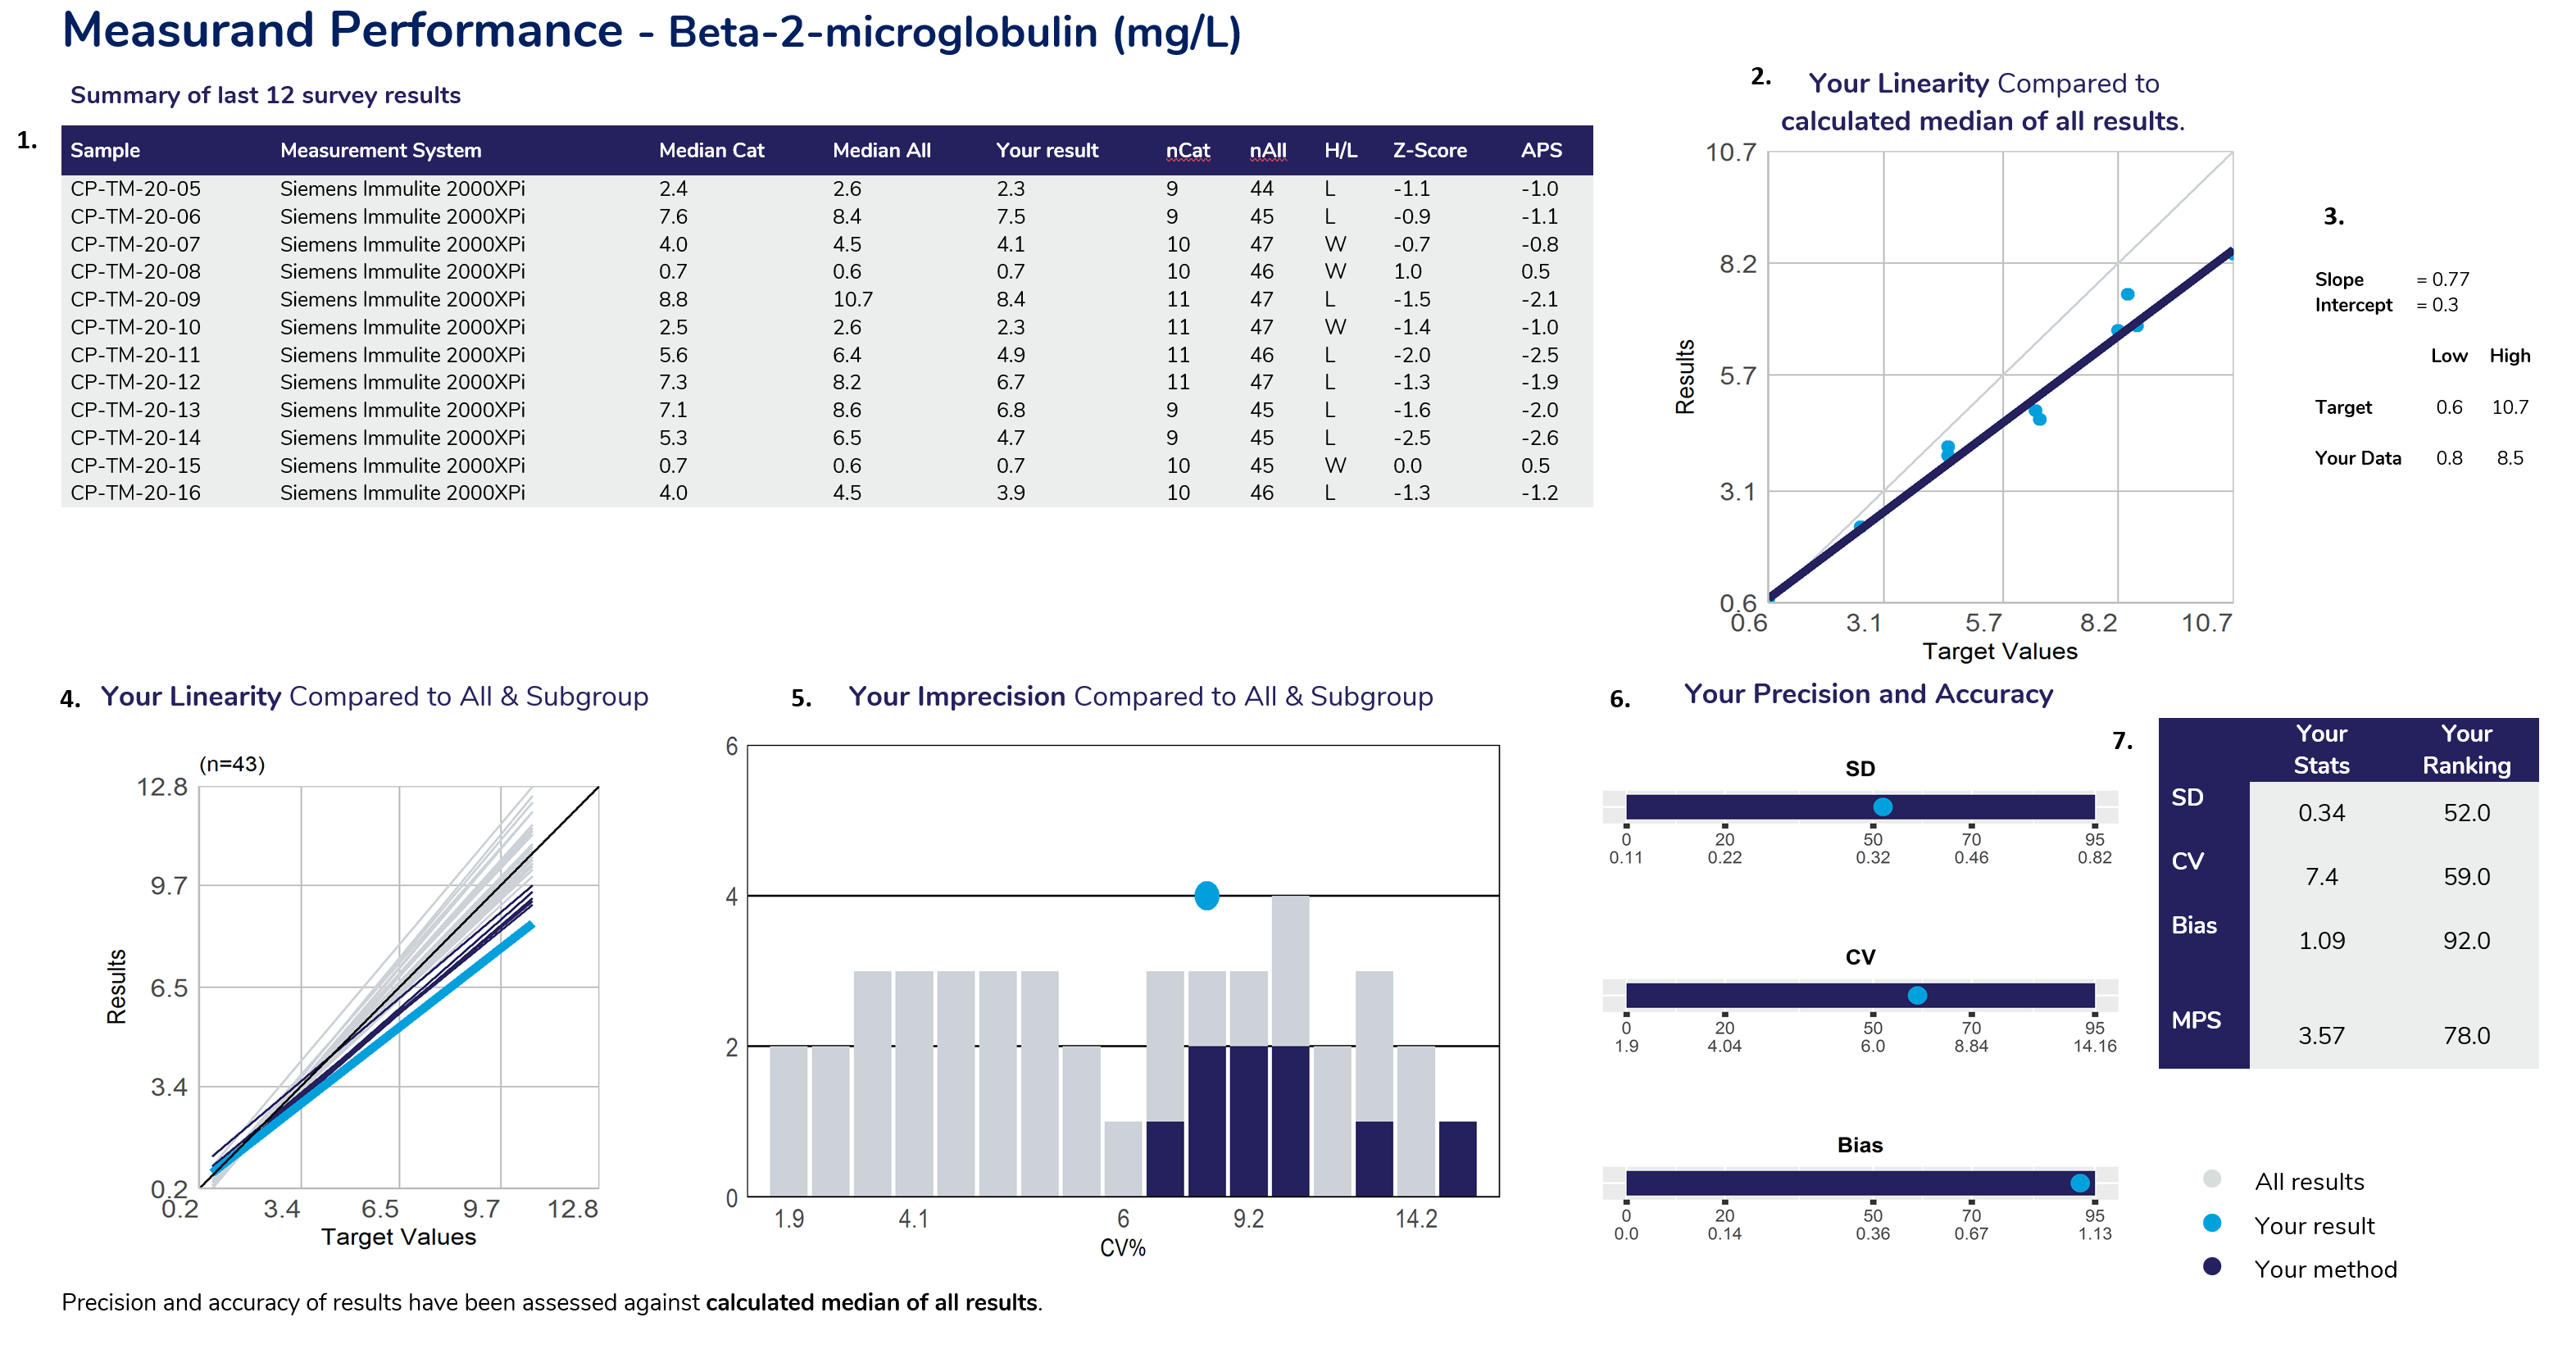
- Summary of results – Indicates what targets are used to compare results (the BNP example above shows results assessed against the instrument category). The table columns represent the Sample ID, Measurement System category assigned for result comparison, median result, participant’s result, H/L review flag (W= Within, no review required), Z-score and the APS score.
- Your Linearity – compared to the target source – Linear regression analysis is based against the target source of each sample, which could be the “median of all results”, “median of the assessment category” (measurement system) or the median of a “specified target”.When performing linear regression, the following rules of assessment are applied:
-
- Minimum of 6 samples are required for linear regression analysis (applies to all target sources)
- If the target source is “median of the assessment category”, there must be a minimum of 6 results in your peer group, for all survey samples, otherwise linear regression is based against the “median of all results”.
- If there is a change of any method category, linear regression is based on the sample range from when the change occurred (applies to all target sources).
-
- Your slope and intercept – Provides the slope and intercept calculated from the linear regression analysis. Also provides the target low and high level, with your corresponding low and high levels determined from the “line of best fit”.
- Your Linearity – compared to the All and subgroup – To provide a comparison of all methods, linear regression is performed against the same data source (all results or specific target). The slopes represent the bias obtained from all laboratories, illustrating the slopes from all labs in ‘grey’, the slope from participants using the same assessment category in ‘navy blue’ and highlighting your slope in ‘light blue’.
- Your Imprecision compared to All & Subgroup – This histogram represents the imprecision (CV%) obtained from all laboratories. It is calculated from the scatter around the target source linear regression line of best. The histogram illustrates all labs in ‘grey’, participants using the same assessment category in ‘navy blue’ and highlighting your CV% as a ‘light blue’ dot.
- Your Precision and Accuracy – Provides participants with the SD, CV and Bias calculated from linear regression and how your results ranked against all laboratories that participated. Ranking (from 0 or best to 100, worst) is illustrated on the top row of the scale provided under the bar.
- Your Stats and Ranking – Provides participants with a table summarising their SD, CV, Bias, MPS and the performance ranking.
- Additional notes – provides participants with information, such as the target source used for linear regression and lists any method category changes made across the survey sample range being analysed.
Method Comparison
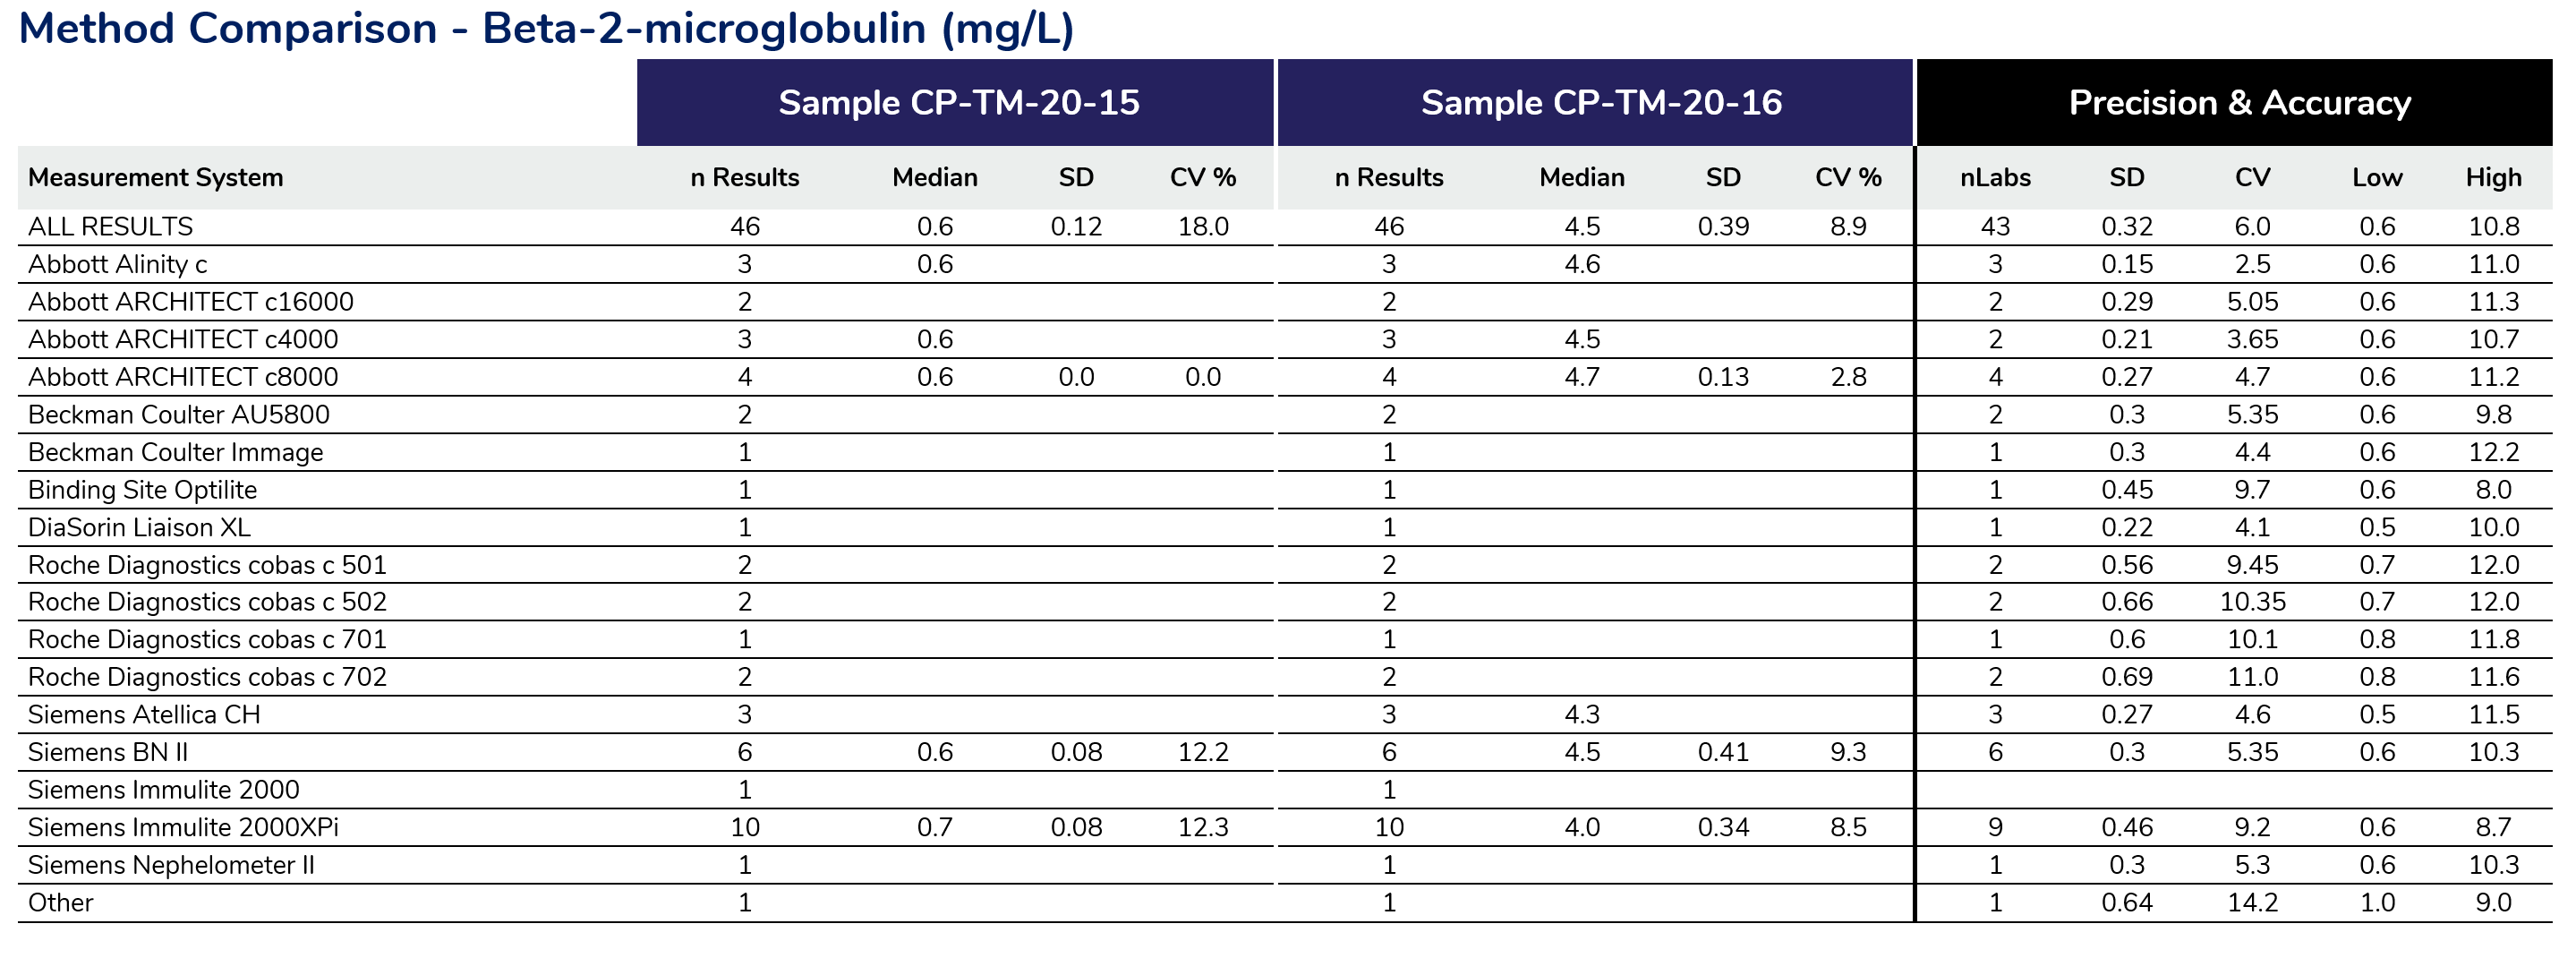
The method comparison provides a breakdown of all the methods (assessment category) used by participants, listing the latest survey results obtained (left) as well as the Precision and Accuracy results calculated from the linear regression analysis on the sample range used, facilitating peer group comparison. The method assessment category will usually be the analytical principle, or the measurement system. The full set of statistics are seen only when there are 4 or more users within a group, 3 users still illustrates the median value obtained and method categories with 2 or less users do not present any statistical data.
Can't find what you're looking for?
