Report Format – Blood Group and Antibody Screen/Identification
The RCPAQAP has developed a new report format for participants enrolled in the Blood Group and Antibody Screen/Identification programs. The new format follows a standard structure that will be adopted by other programs offered by the RCPAQAP.
The structure of the new report is as follows.
Summary of Performance
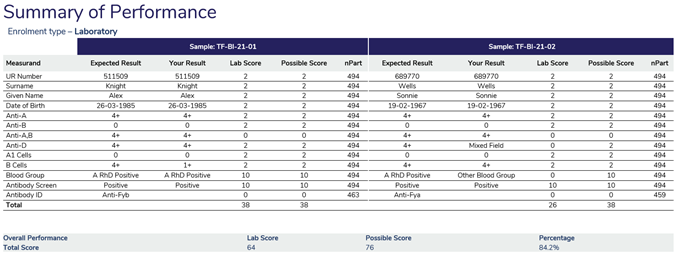
An explanation of data populated in the table columns in the above example is provided below.
- Measurand: All measurands that are assessed are presented in the summary table.
- Expected Result: The expected result lists the target result for the measurand.
- Lab Score: This is the score provided to the laboratory, which is based on ‘your result’.
- Possible Score: This is the maximum score possible allocated to the measurand.
- nPart: This is the number of participants that have participated and returned results for the measurand.
- The Overall Performance under the table provides participants with total “Lab Score”, which adds the scores given for both samples. The Possible score represents the total possible score for both samples. The “Percentage” is the Lab Score divided by the Possible Score multiplied by 100.
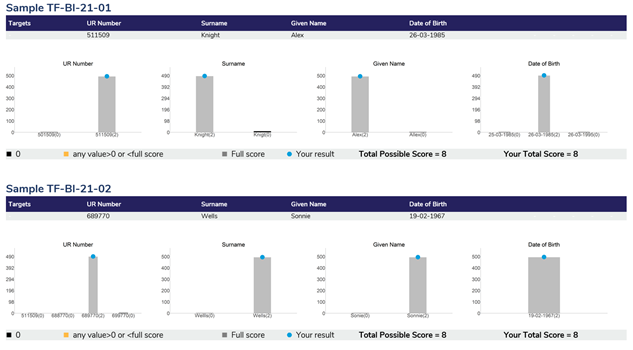
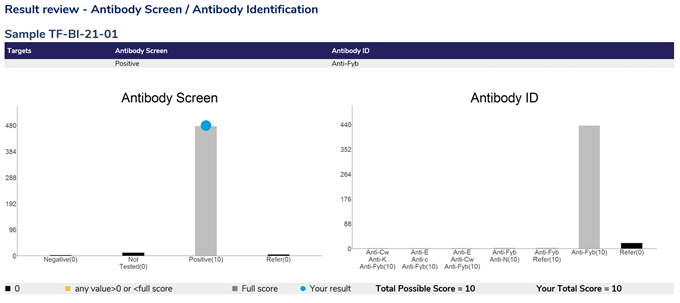
Result Review – Patient Identification
Section 1
Section 2
Section 3
The Result Review is divided into three main areas to review the participant performance in
- Patient Identification
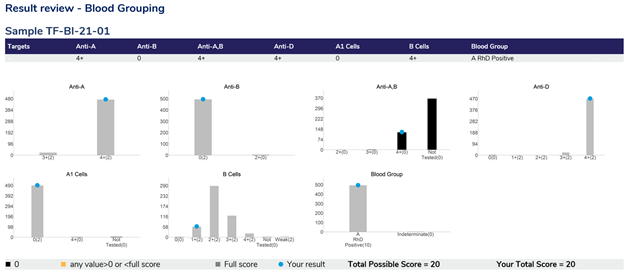
- Blood Grouping
- Antibody screen and identification
The top of each page lists the target/expected results for all tests.
The histograms represent the results returned by all participants,
- The blue circle represents the result from your laboratory.
- The colour of the histogram bar represents the scores provided to the responses received
- Grey bars represent a full score
- Amber bars represent any score greater than zero and less than the full score
- Black bars represent responses that received a score of zero.
The actual score allocated to each response can be seen in brackets next to the legend on the x-axis, e.g. Anti-Fyb(10).
The ‘total possible score’ and ‘your total score’ for each section is provided at the bottom of each result review page.
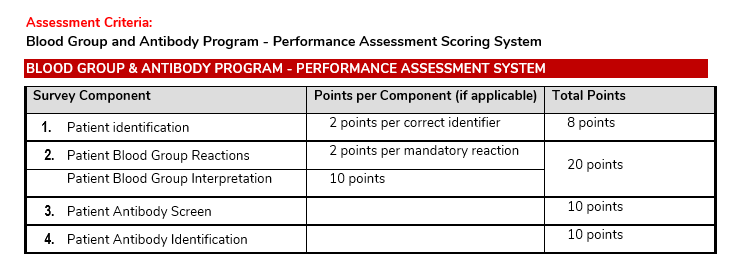
Method Comparison Table
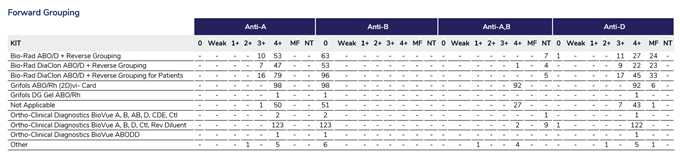
The method comparison table provides a breakdown of all the methods (measurement system) used by participants, listing the survey results for each surveyed test/measurand.
- Discussion: A discussion of the survey results will also be available at the end of the report as required.
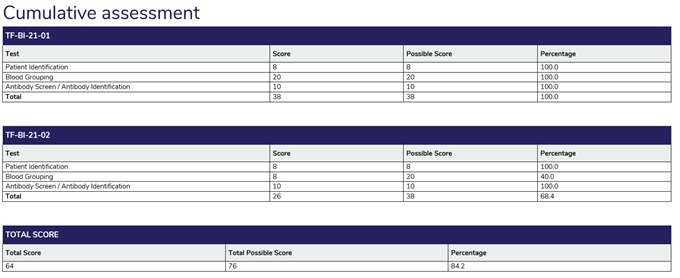
Cumulative Assessment
All reports conclude with a cumulative assessment, which provides participants with the scores obtained for each survey, and overall performance as a percentage.
Can't find what you're looking for?
