Report Format – Supervisor Report
The RCPAQAP has updated the report format issued to participants enrolled as a Supervisor in any program that offers Supervisor reports.
The structure of the new report is as follows:
Supervisor Group
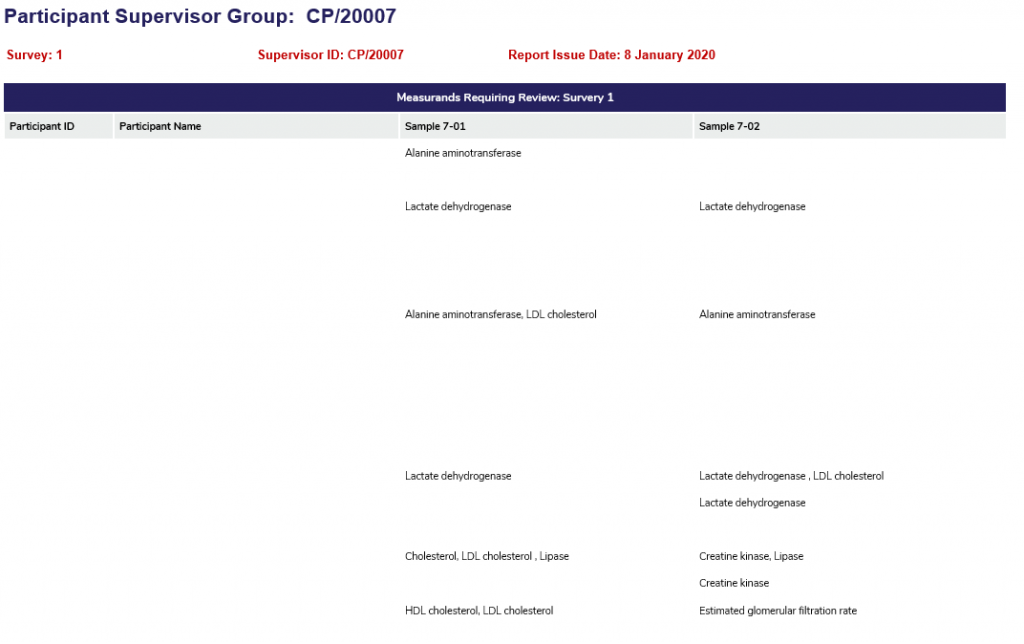
The first section of the Supervisor report will supply a list of all participants that belong to the Supervisor report. The adjacent columns highlight the measurands that have been flagged for review in the most current survey run.
Distribution of All Results vs Group
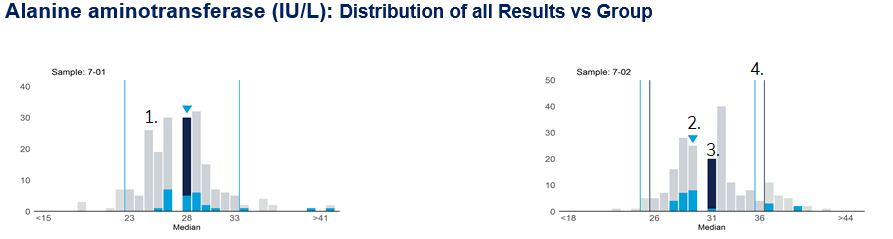
- The histograms provide a distribution of results received from ALL participants (grey bars) for each survey sample. Results from the Supervisor group are transposed on the bar and are highlighted in blue.
- The dark blue bar in the histograms represent the median of all results submitted.
- The light blue triangle at the top of the bar represents the median of the Supervisor group.
- The APS bars are highlighted in grey (ALL results) or blue (Supervisor group). Please note: if only “Blue” APS bars are appearing on the histrogram, this means that the APS limits are shared by ALL results and the Supervisor group.
Measurand Result Analysis by Supervisor Group
The result analysis page provides a review of the results received from participants within the Supervisor group.
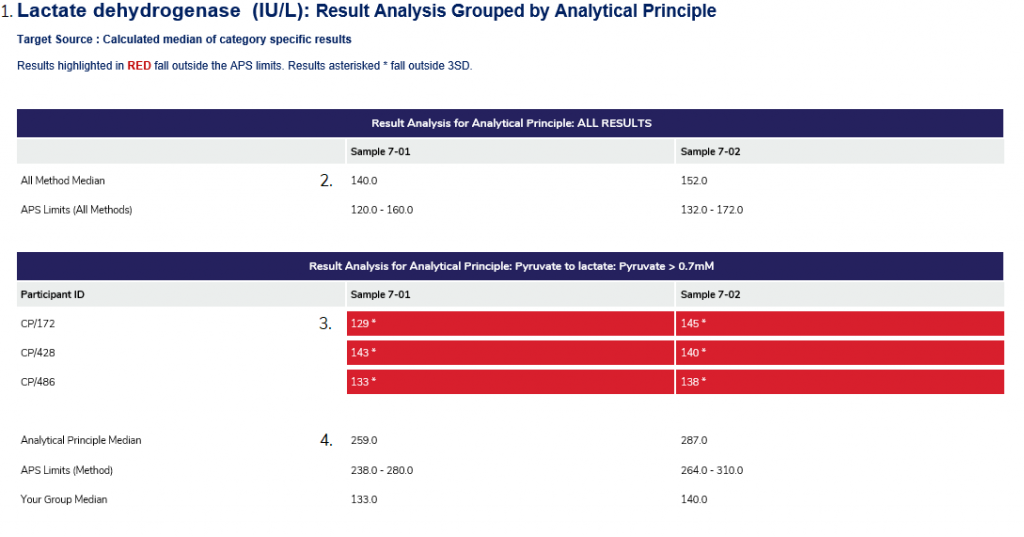
- Provides the measurand name and the associated base unit. This section will also display the target source, whether it was calculated by the method category, all results or is a known target.
- The first table represents the All Method Median or Target result, providing the APS range.
- The following tables are a breakdown of the results submitted by the Supervisor group, broken down by the assigned method category for the measurand (for example, Analytical Principle, Measurement System or Calibrator). Results that are outside the APS of ALL results are highlighted in red. An asterisk indicates that the result falls outside 3SD of the median.
- Provides the median of the method category assigned to the measurand, the APS limits and provides the group median of the participants assigned to the method category.
Can't find what you're looking for?
