Dashboard
When you log into the myQAP portal, the dashboard is displayed, providing a snapshot of your laboratory’s performance.
To view a video explainer on this functionality, click here.
The dashboard allows easy identification of missed or late survey result submissions, report review statuses, and will help facilitate any required corrective action.
If you oversee multiple laboratories, the dashboard will display survey result submissions and report reviews of all laboratories or departments in your network, within the time period selected by you.
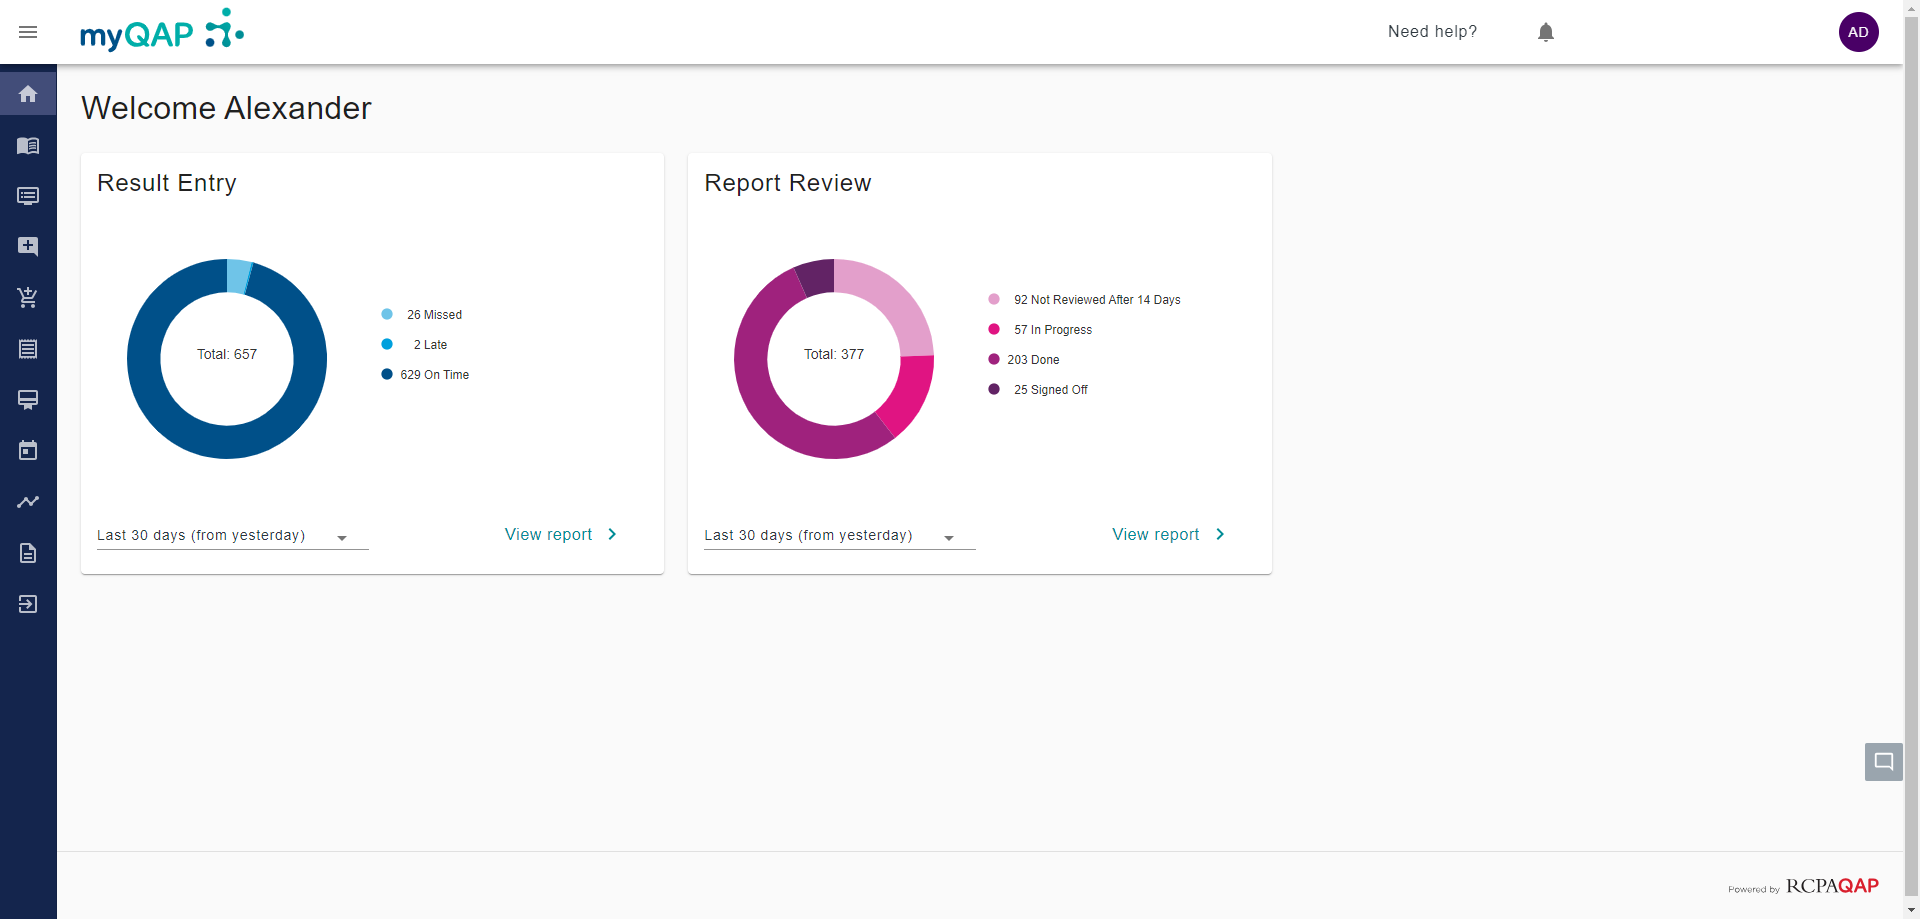
There are two charts providing different information. The chart on the left relates to result entry information, while the chart on the right displays report review information.
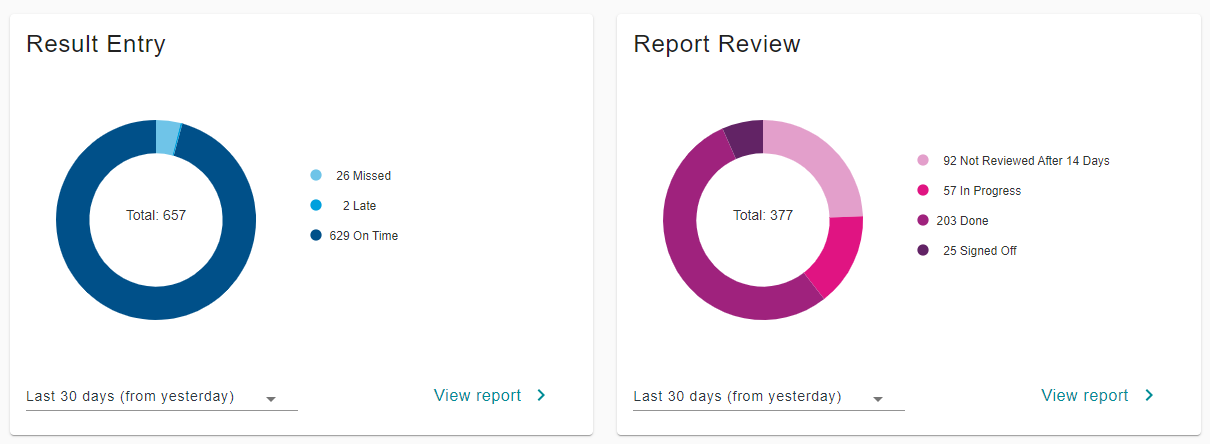
Result entry information is split into 3 categories. “Missed”, for where no survey results were returned before the closing date. “Late”, for results accepted as late by the RCPAQAP. And, “On Time”, for all successfully submitted results entered before the closing date.
Report review information is split into 4 categories. “Not reviewed after 14 days”, is for reports that have been released over 14 days ago, and a review has not started. “In Progress”, is all reports that have begun the result review process, but have proceeded no further. “Done” is for when the review has been completed by staff, but not signed off by a supervising pathologist or department head as required. And “Signed Off” is the final status given once all checks are completed and marked off.
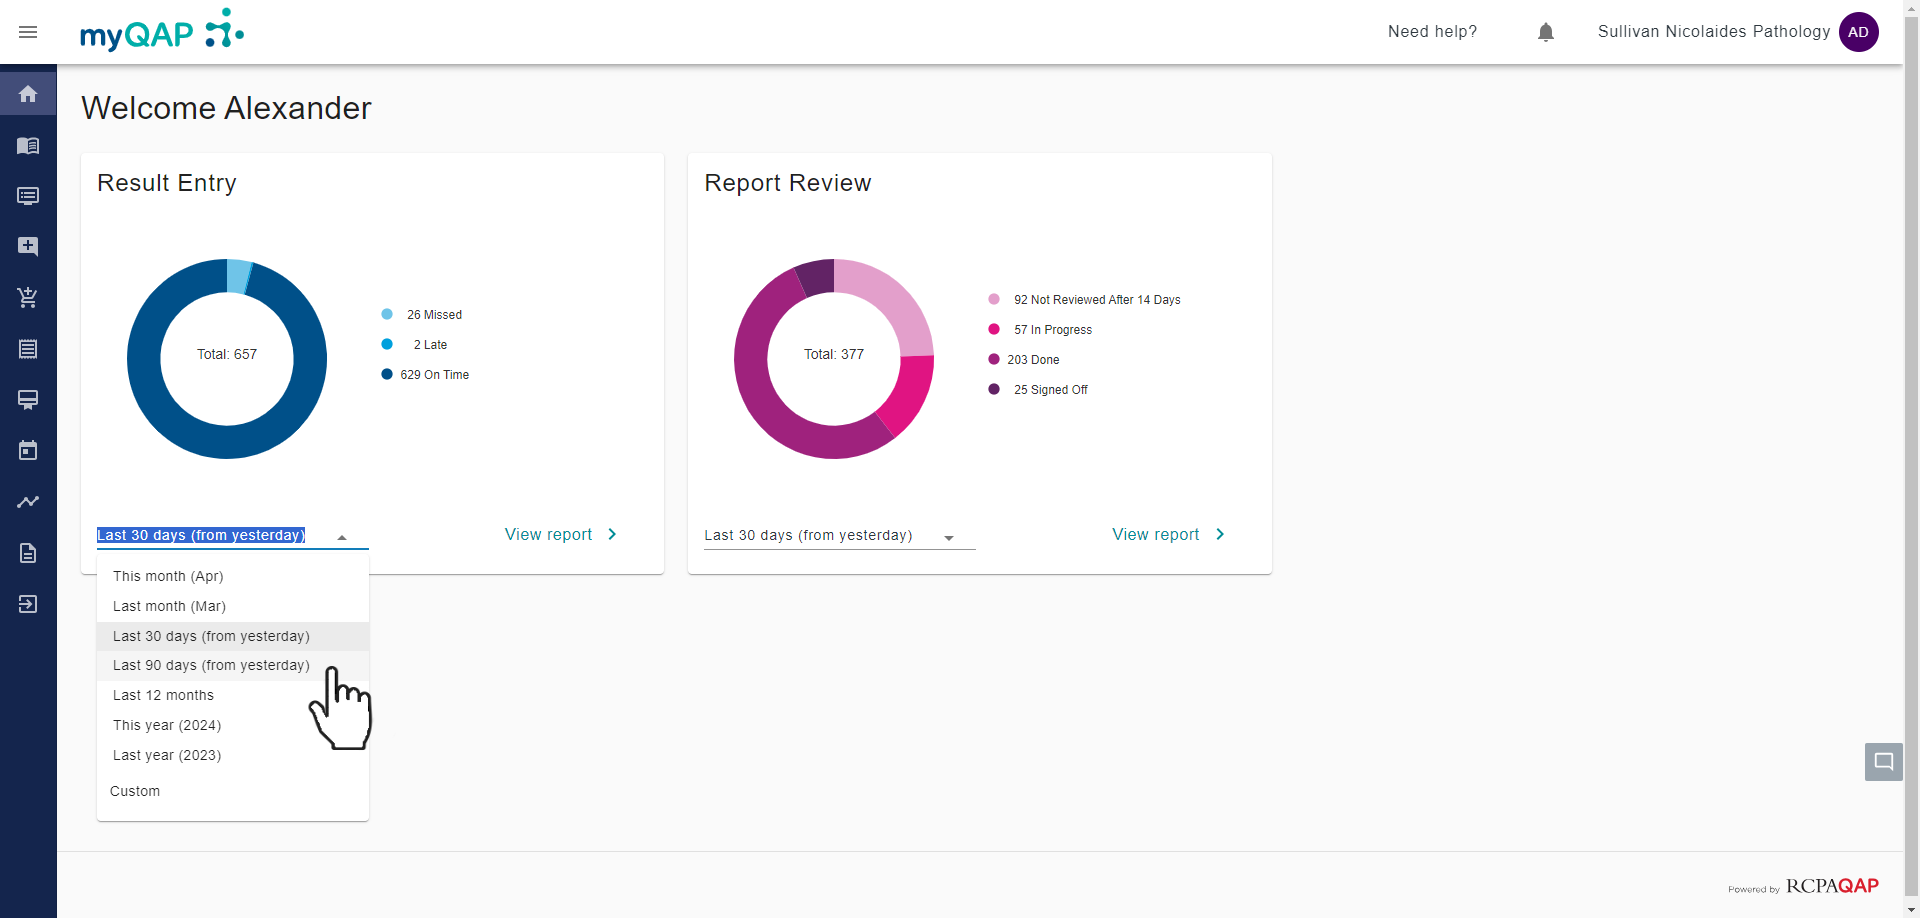
Below these charts is a date range selector. This will update the information within the charts, relevant to your selection.
Digging Deeper
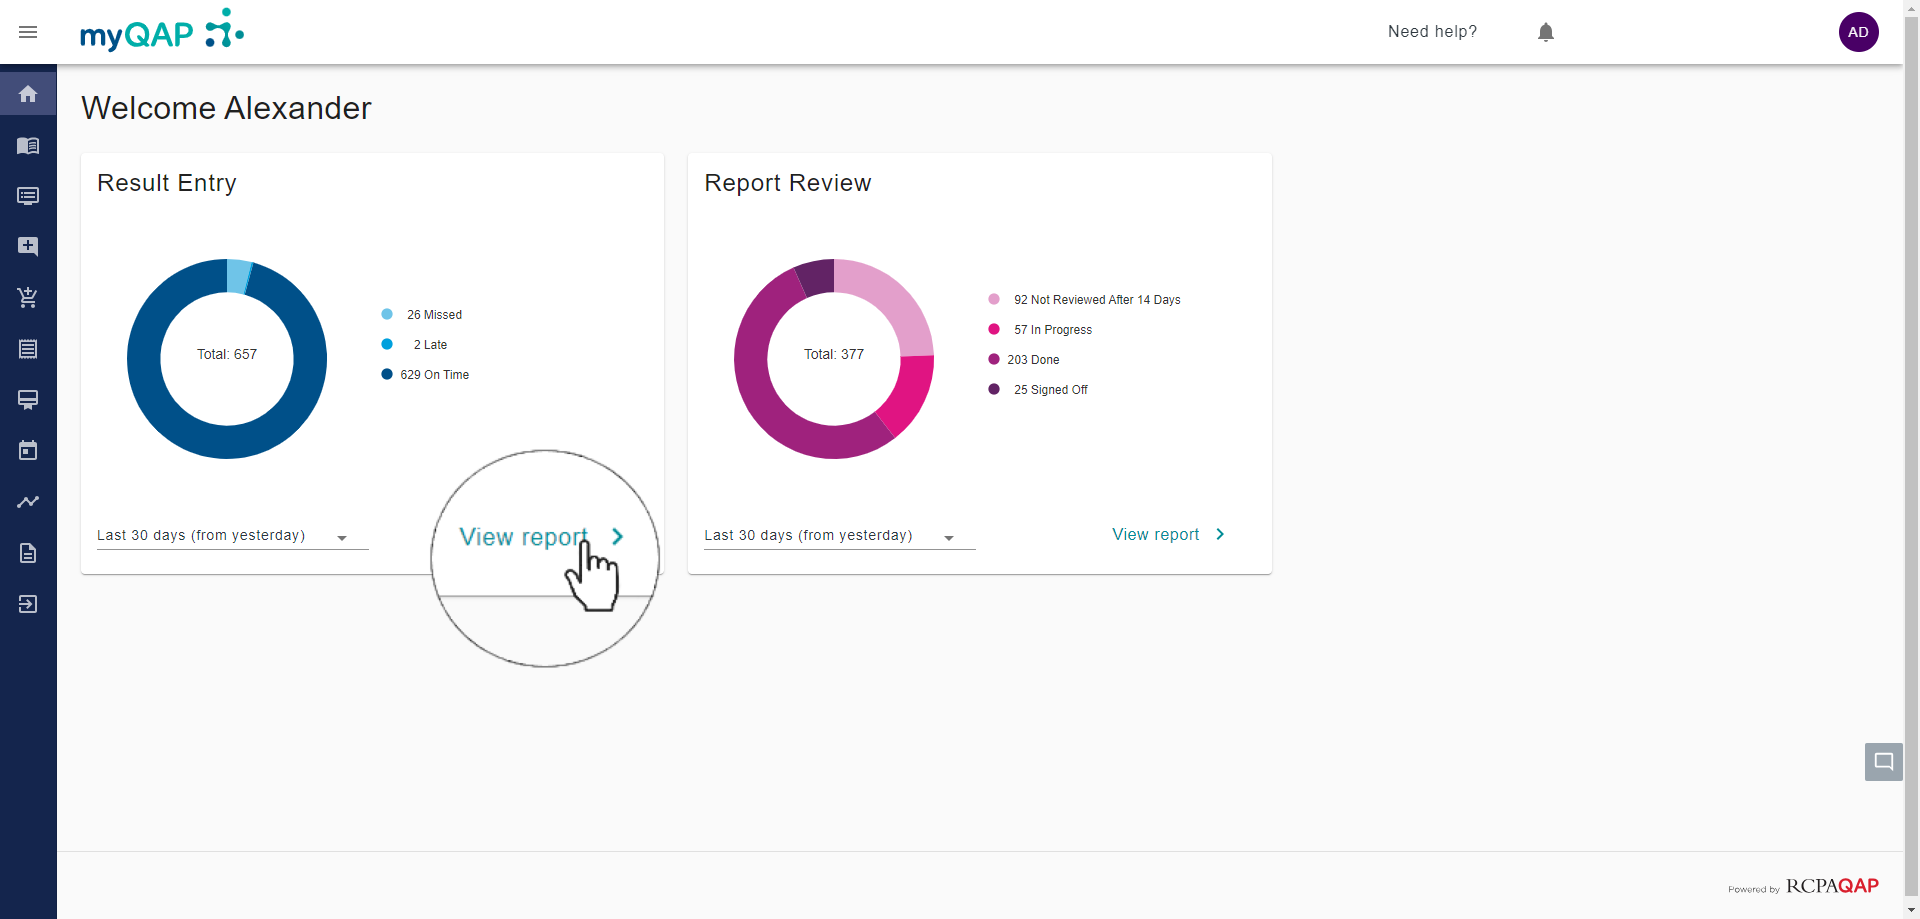
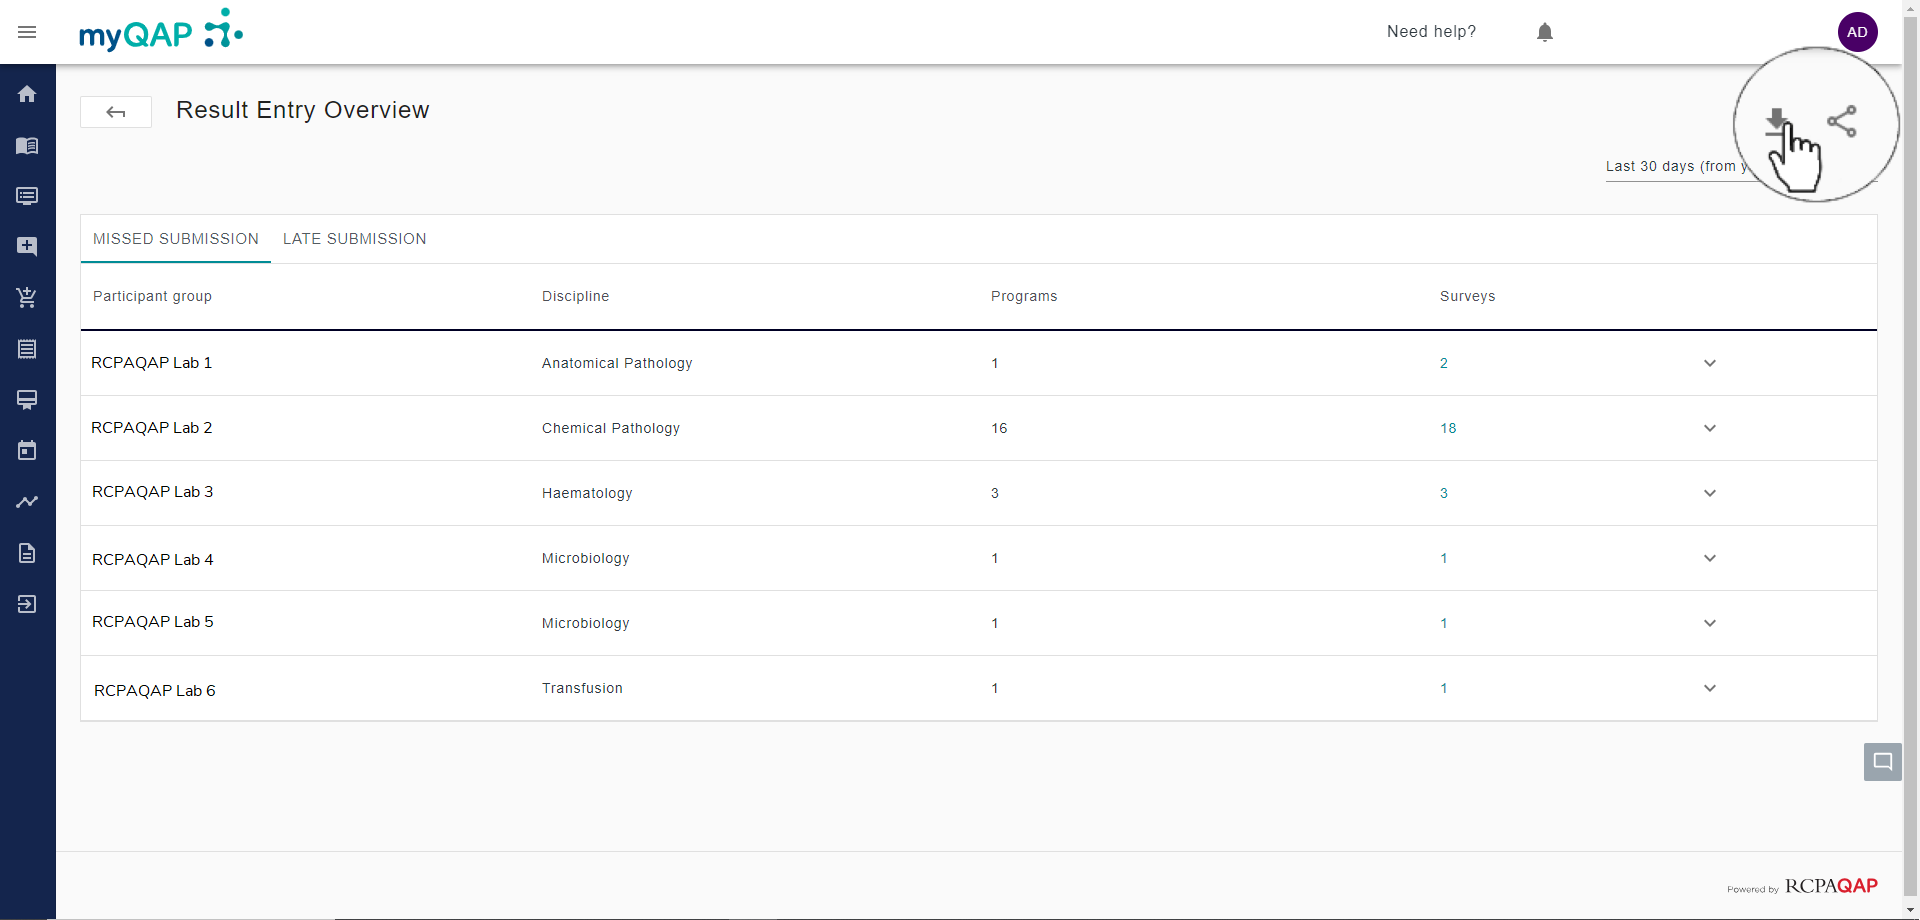
For a comprehensive breakdown of the data, click the “View report”, button. Clicking the button on the result entry chart will provide a breakdown of all missed and late submissions, whilst clicking on the report review section will show all in progress or not started reviews.
The data is split into columns providing the Participant Group or Site, the discipline, the number of programs affected for that participant group and discipline, followed by the number of reports affected for that participant group and discipline.
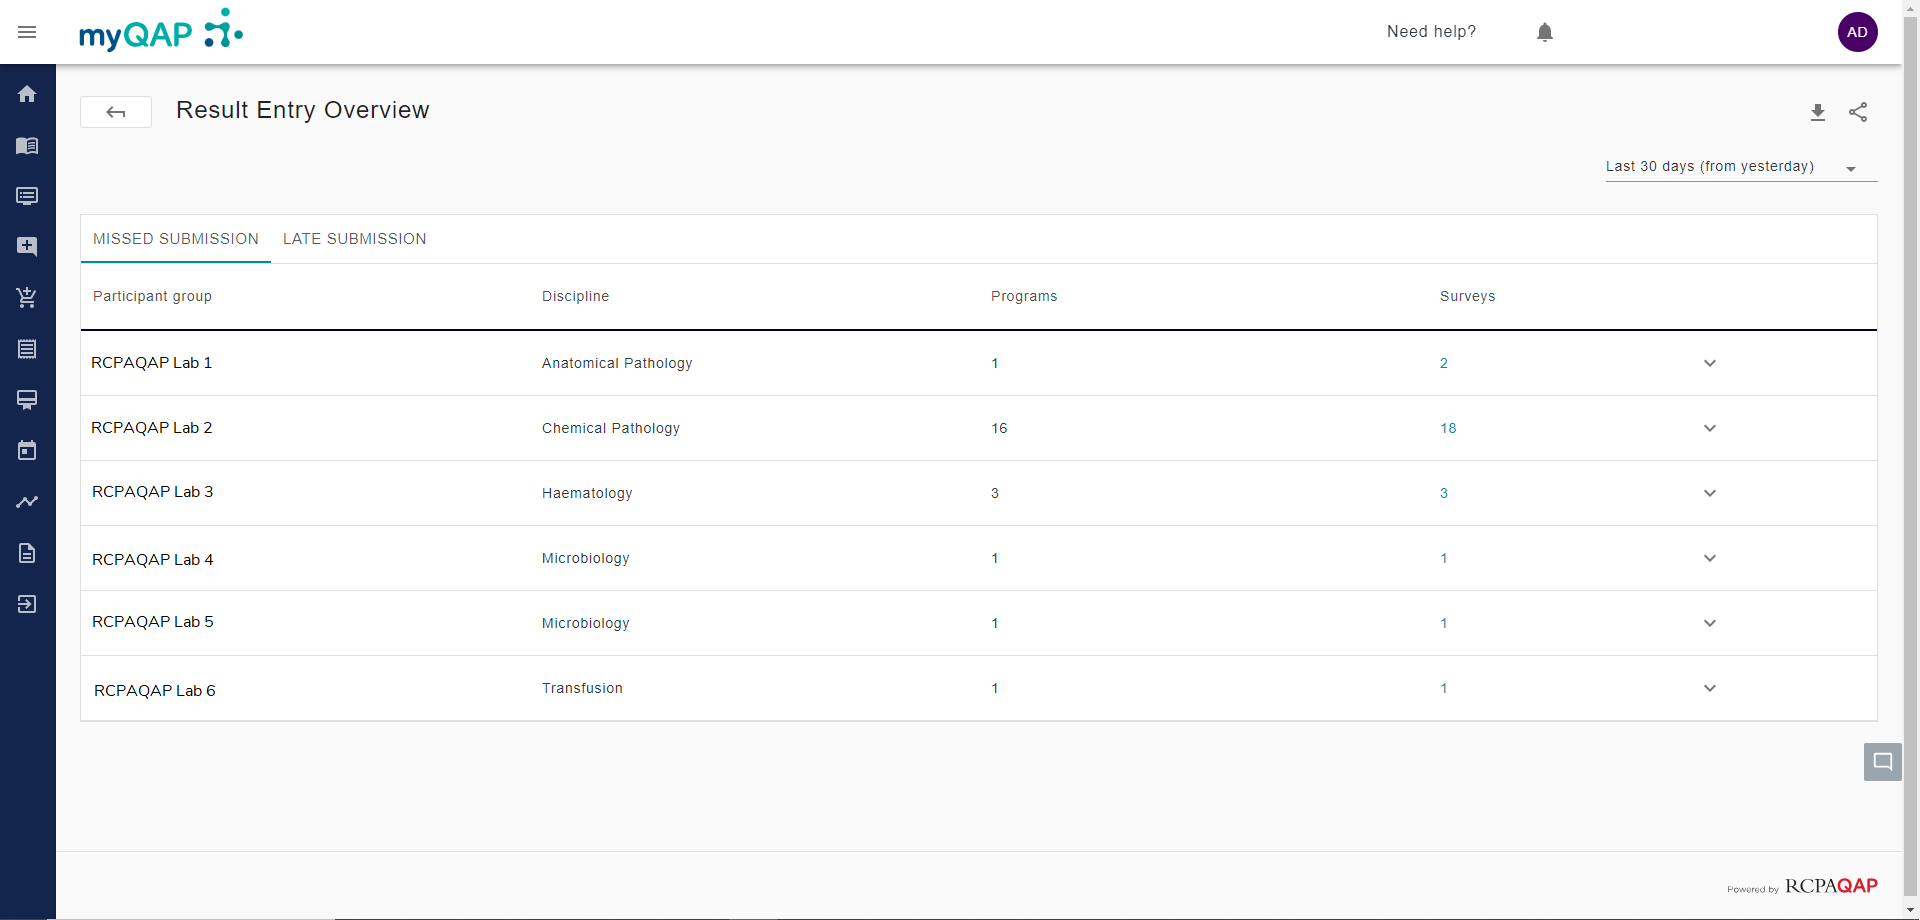
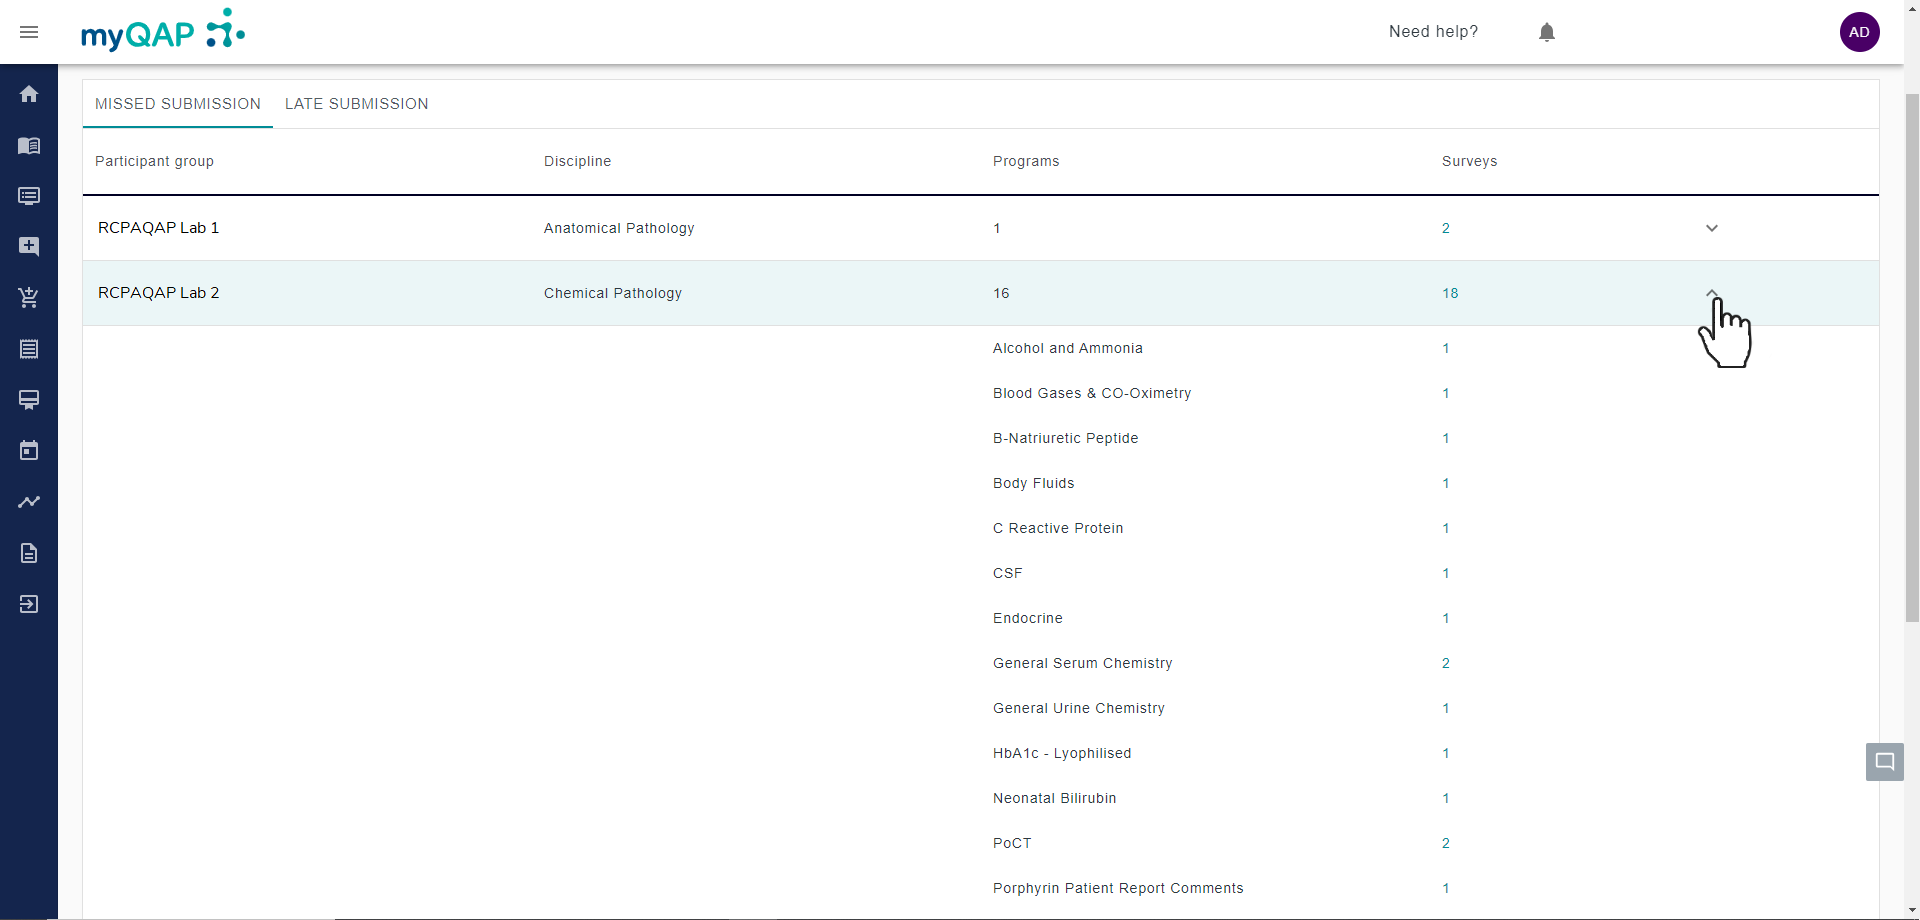
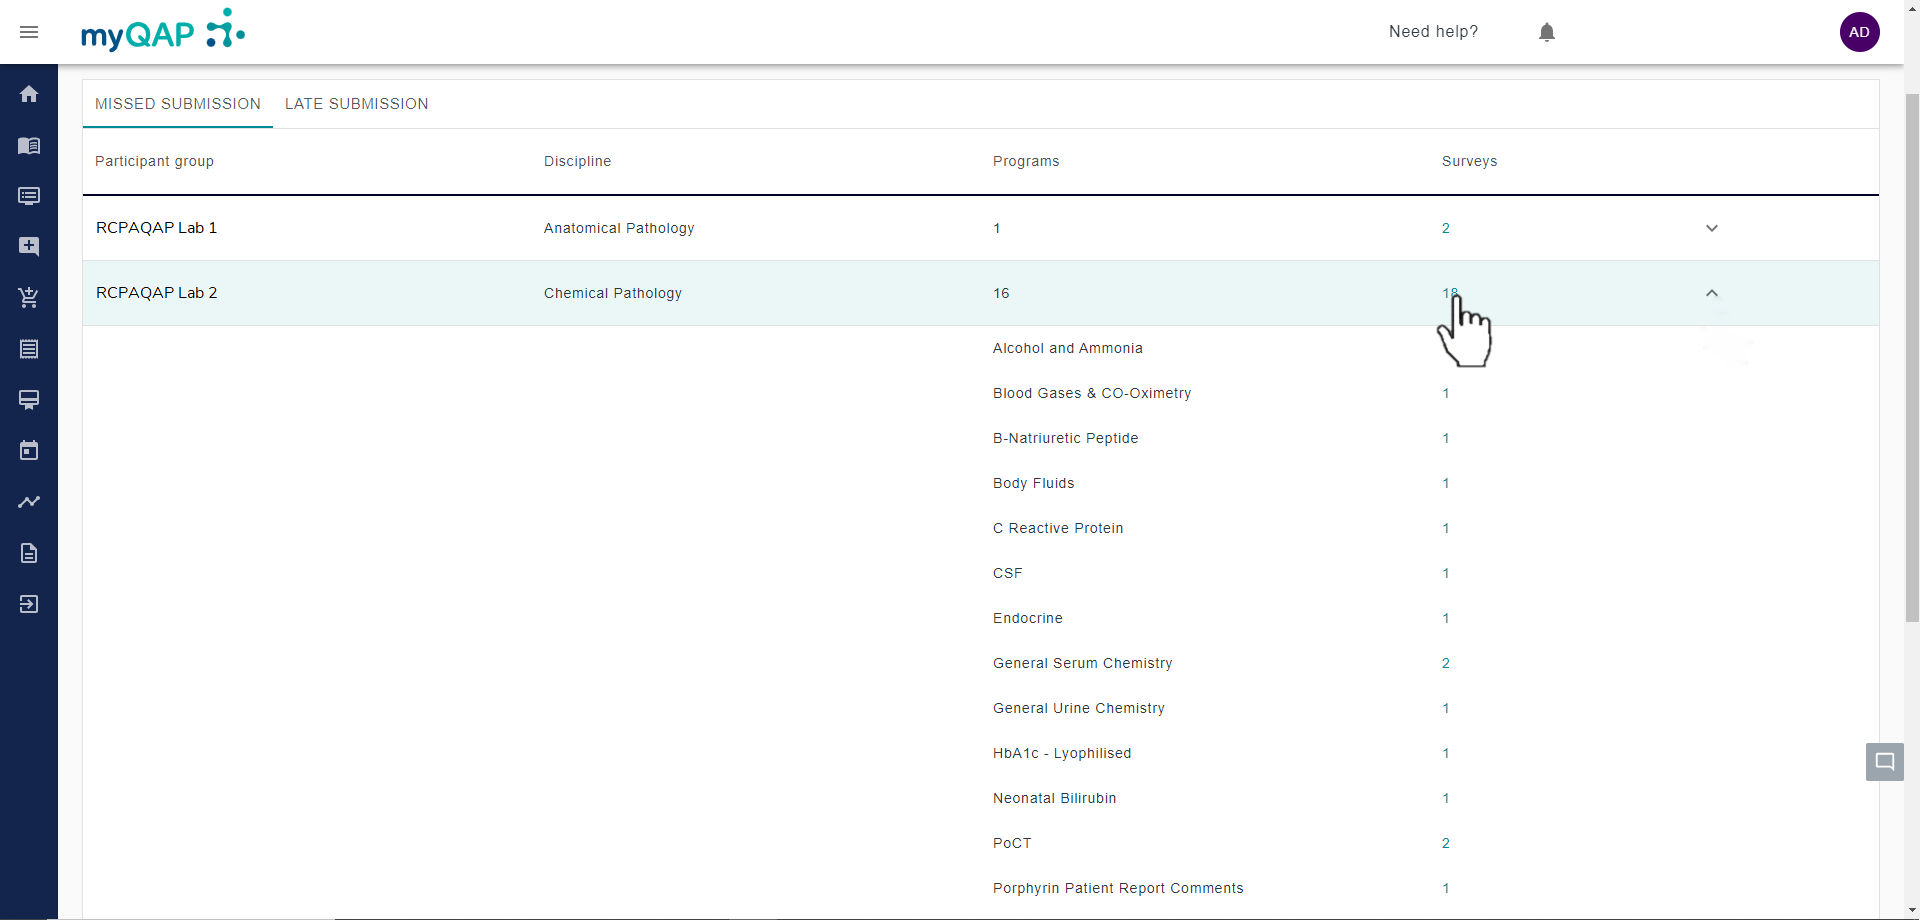
Click the arrow on the drop-down menu to view each individual program reported for your selection.
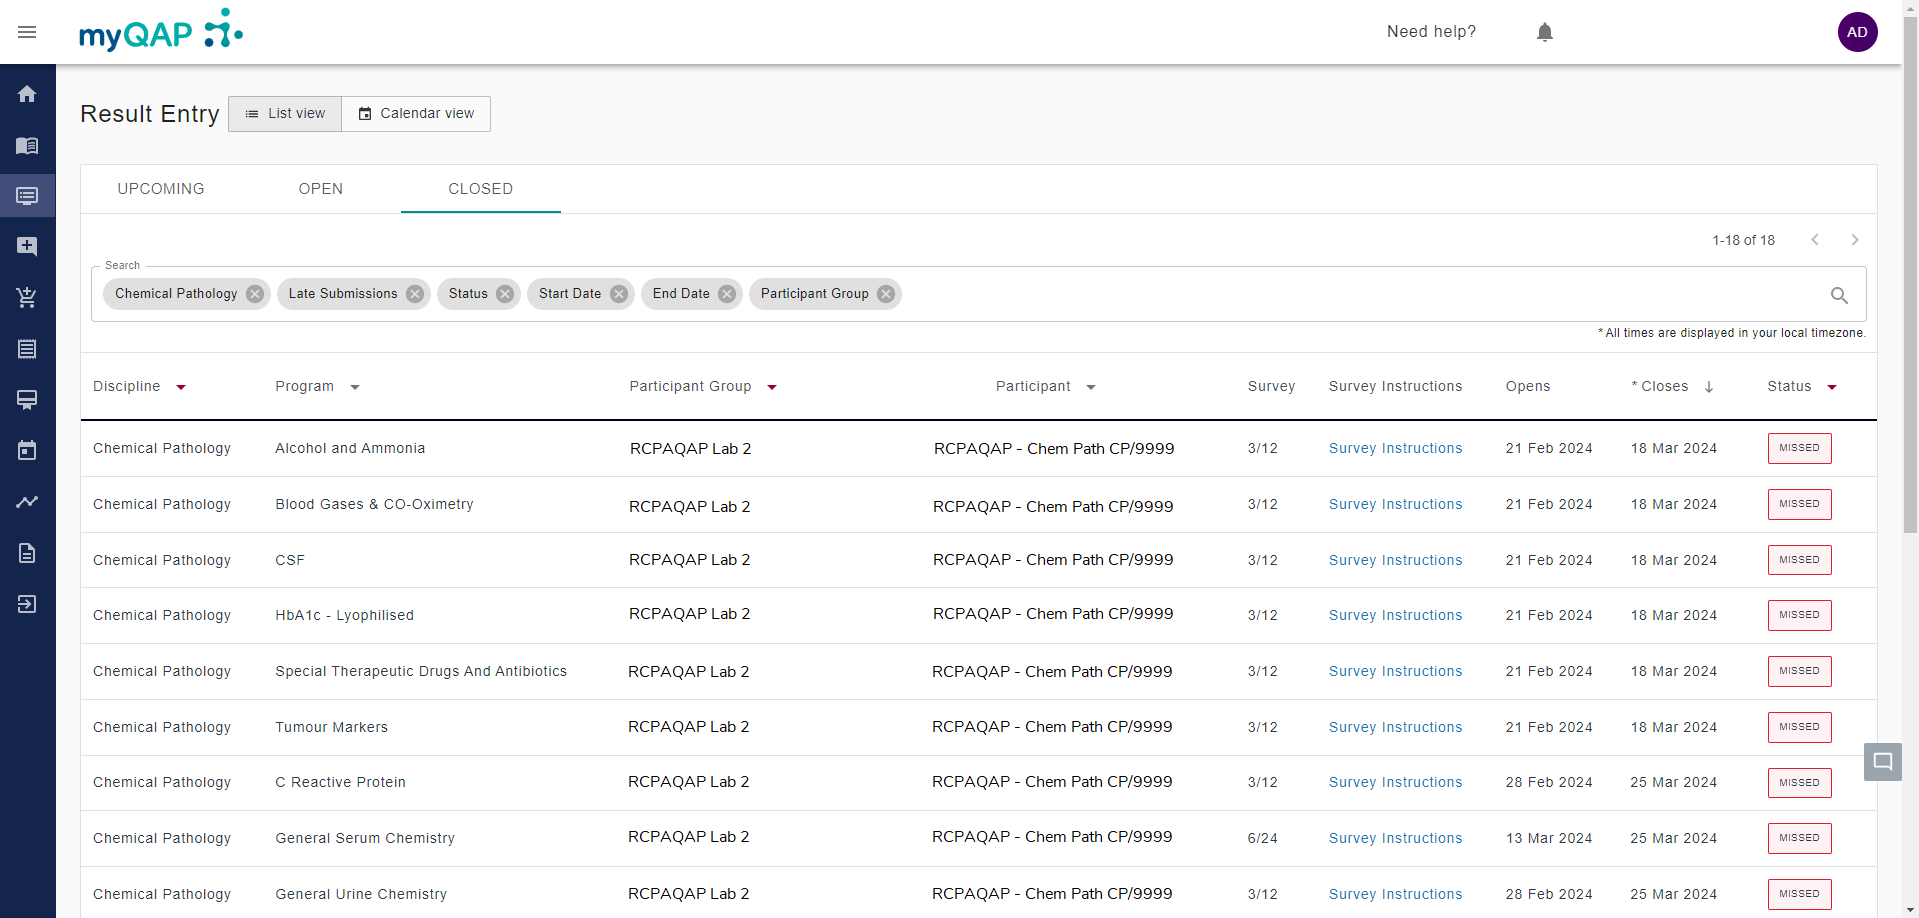
Clicking the link takes you to a new page, where filters related to the information selected on the previous screen will automatically be applied.
A spreadsheet of this data can downloaded by clicking the download button. Copying the page link and sharing with a colleague is also available.
This portal innovation is still in development and your feedback is welcome. Please log a request with your comments or suggestions.
Can't find what you're looking for?
