Histogram (Qualitative and Quantitative)
RCPAQAP Analytics has been upgraded and the current release provides added functionalities to view and analyse qualitative measurands.
After selecting the Discipline, the program, the survey year and the measurand you wish to analyse, the appropriate tabs will be displayed to view the data in different views, based on the type of measurand. By selecting any qualitative measurand in a program that has a relationship to a quantitative measurand, such as a result and the interpretation, you will note a tab “HISTOGRAM (QUALITATIVE AND QUANTITATIVE)
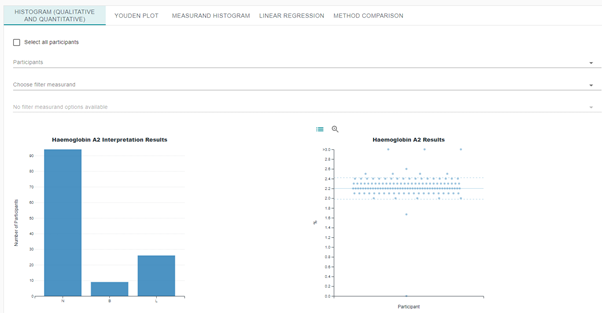
Two charts will appear, on the left-hand side is the distribution of the qualitative results and on the right displays the associated quantitative results as a scatterplot (Figure 1).
When your participant selection is made, further information is displayed that provides the consensus values of the returned qualitative results with the corresponding statistical analysis for the associated quantitative measurands (Figure 2). Participant results will also be highlighted on the histogram and scatterplot as a red marker.
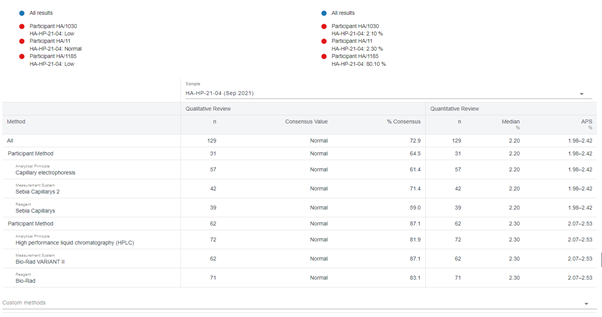
Selecting any of the method parameters individually will highlight the results within the histogram and scatterplot in a different colour.
A filter based on “Custom methods” is also available where you can select any method available to review the performance against the survey results.
Can't find what you're looking for?
